KPIs for Relationship Selling: 12 Metrics That Actually Matter
Activity dashboards reward busywork, not trust. Here are the 12 KPIs for relationship selling that predict renewals, referrals and expansion revenue — plus how to instrument each one without adding CRM admin work.
TL;DR
- Activity KPIs (dials, emails sent, meetings booked) measure effort. Relationship selling KPIs measure whether that effort is compounding into trust, retention and referrals.
- The twelve metrics that actually predict relationship-led revenue fall into four groups: depth, trust, expansion and efficiency.
- Two numbers do most of the work: referral-sourced pipeline % and multi-threading depth (contacts engaged per account). Both are leading indicators of renewal.
- Most teams fail at relationship KPIs because their contact data is stale, not because their reps are bad at relationships. Fix the data layer first.
- Review relationship KPIs quarterly, not weekly. Trust doesn't move on a seven-day cadence, and weekly scrutiny pushes reps back into activity theater.
What is relationship selling, and why do its KPIs look different?#
Relationship selling is the approach where the deal is a byproduct of a durable, high-trust connection rather than the goal of a single campaign. You invest in understanding the buyer's world, you stay useful between purchase cycles, and you earn expansion and referral revenue that transactional sellers never see.
The measurement problem is obvious once you name it: trust has no timestamp. A CRM can log that you sent 47 emails. It cannot log that the VP of Ops now forwards your content to her peers unprompted.
So relationship selling KPIs have three properties that activity KPIs don't:
- They are lagging-heavy, so you need paired leading indicators. Net revenue retention is the truth, but it arrives 12 months late. Multi-threading depth arrives in week three.
- They are account-level, not rep-level. A relationship lives across an org chart, not in one inbox.
- They punish volume gaming. You can fake 100 dials. You cannot fake a customer agreeing to a reference call.
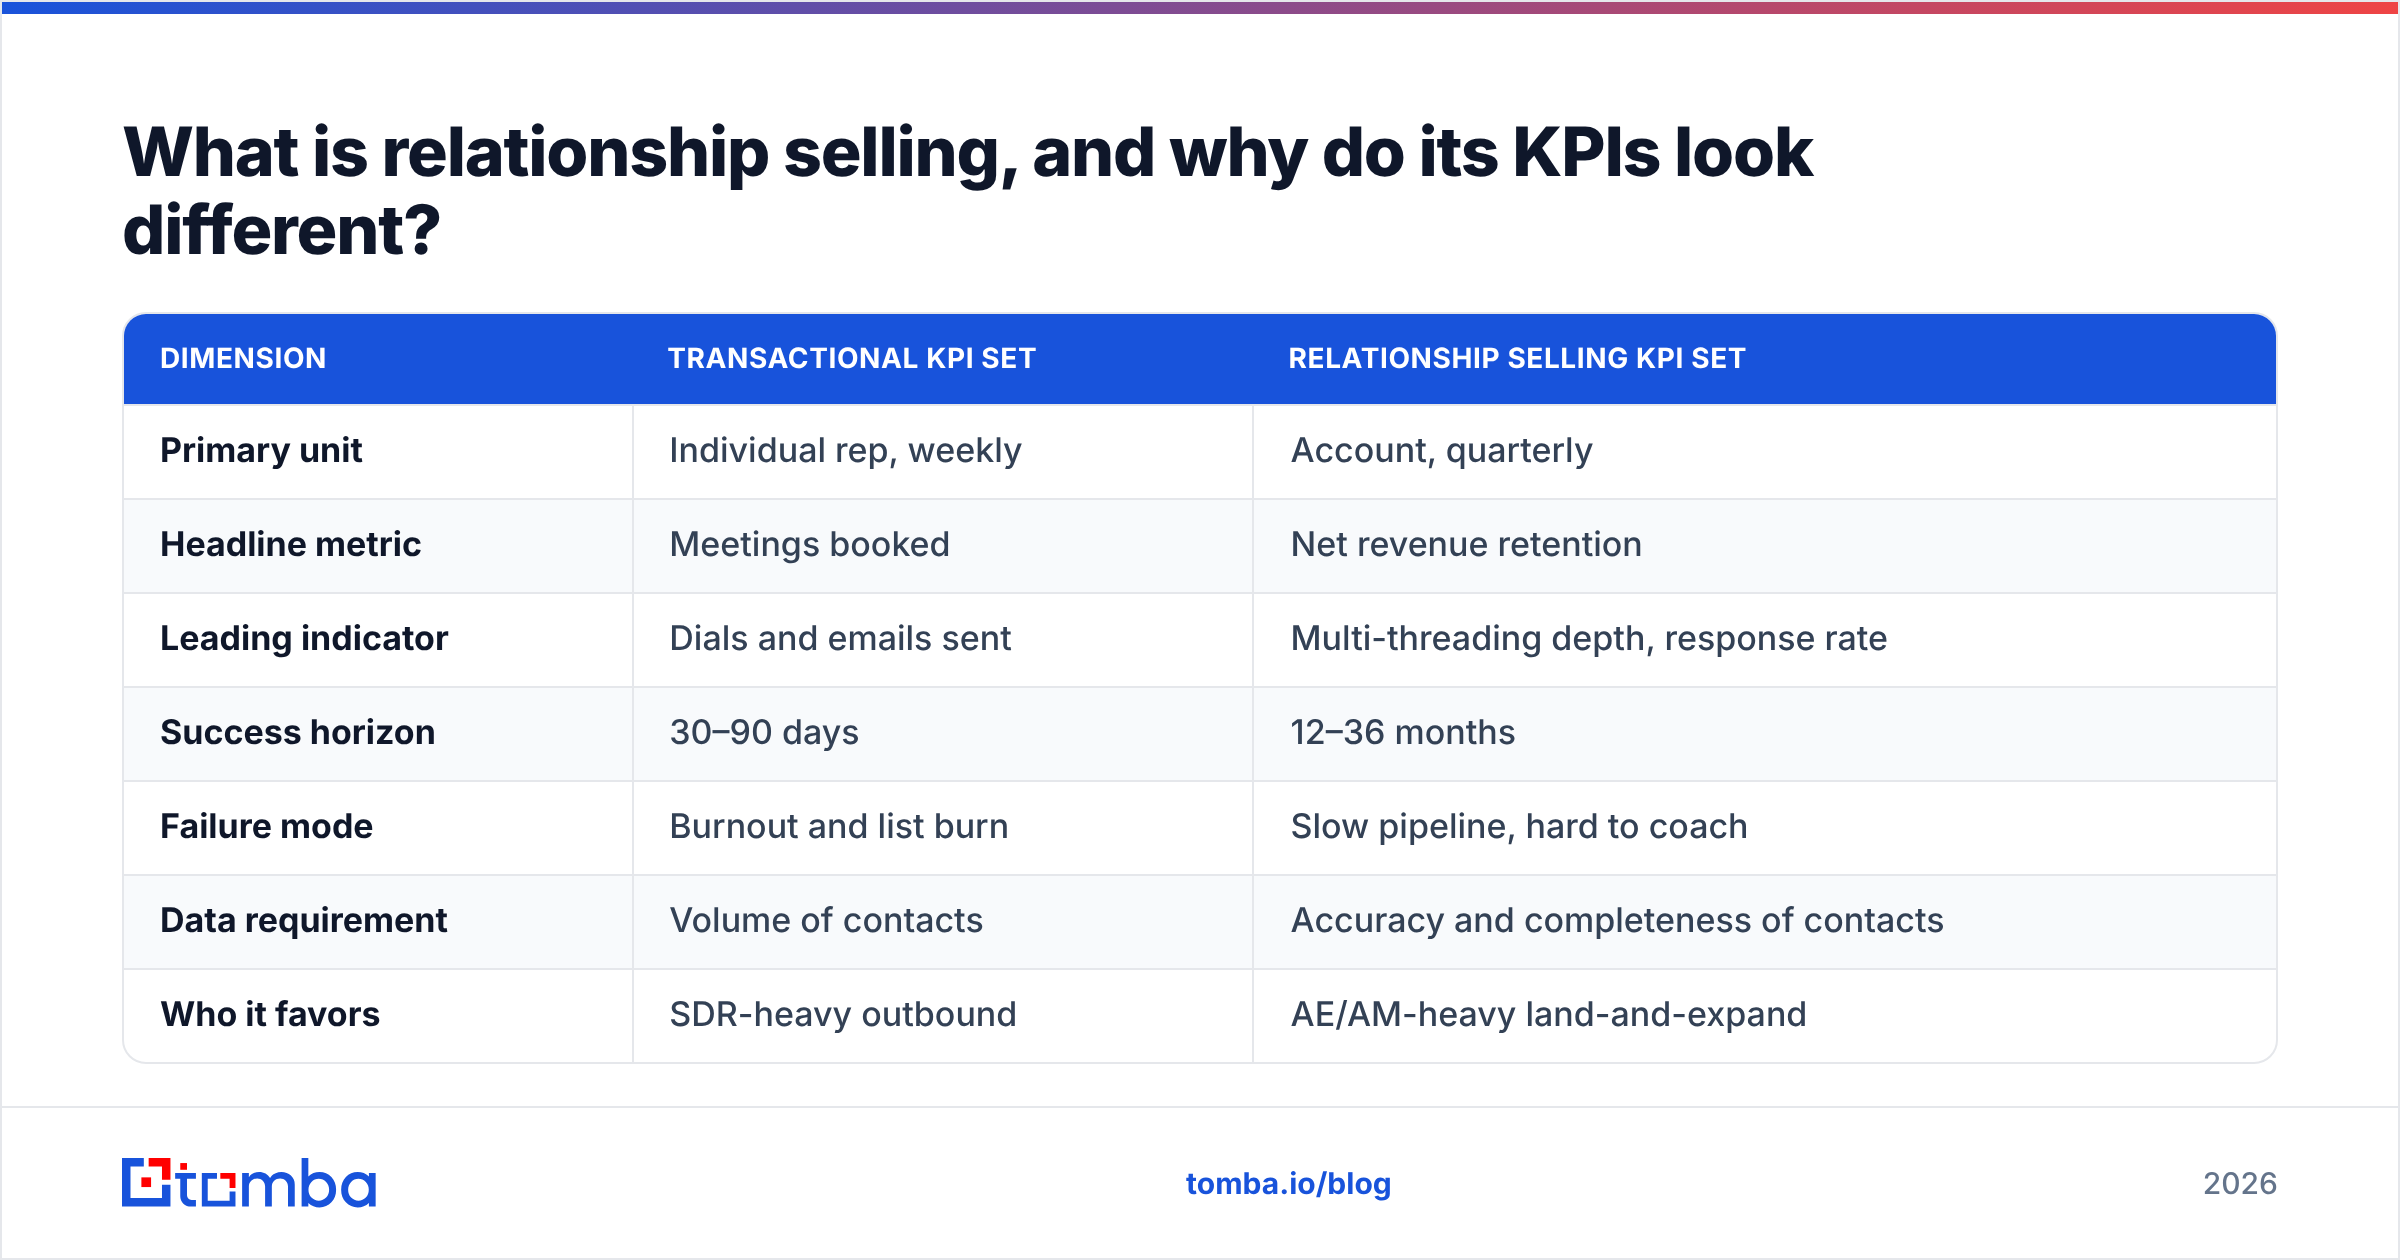
Compare the two measurement philosophies directly:
| Dimension | Transactional KPI set | Relationship selling KPI set |
|---|---|---|
| Primary unit | Individual rep, weekly | Account, quarterly |
| Headline metric | Meetings booked | Net revenue retention |
| Leading indicator | Dials and emails sent | Multi-threading depth, response rate |
| Success horizon | 30–90 days | 12–36 months |
| Failure mode | Burnout and list burn | Slow pipeline, hard to coach |
| Data requirement | Volume of contacts | Accuracy and completeness of contacts |
| Who it favors | SDR-heavy outbound | AE/AM-heavy land-and-expand |
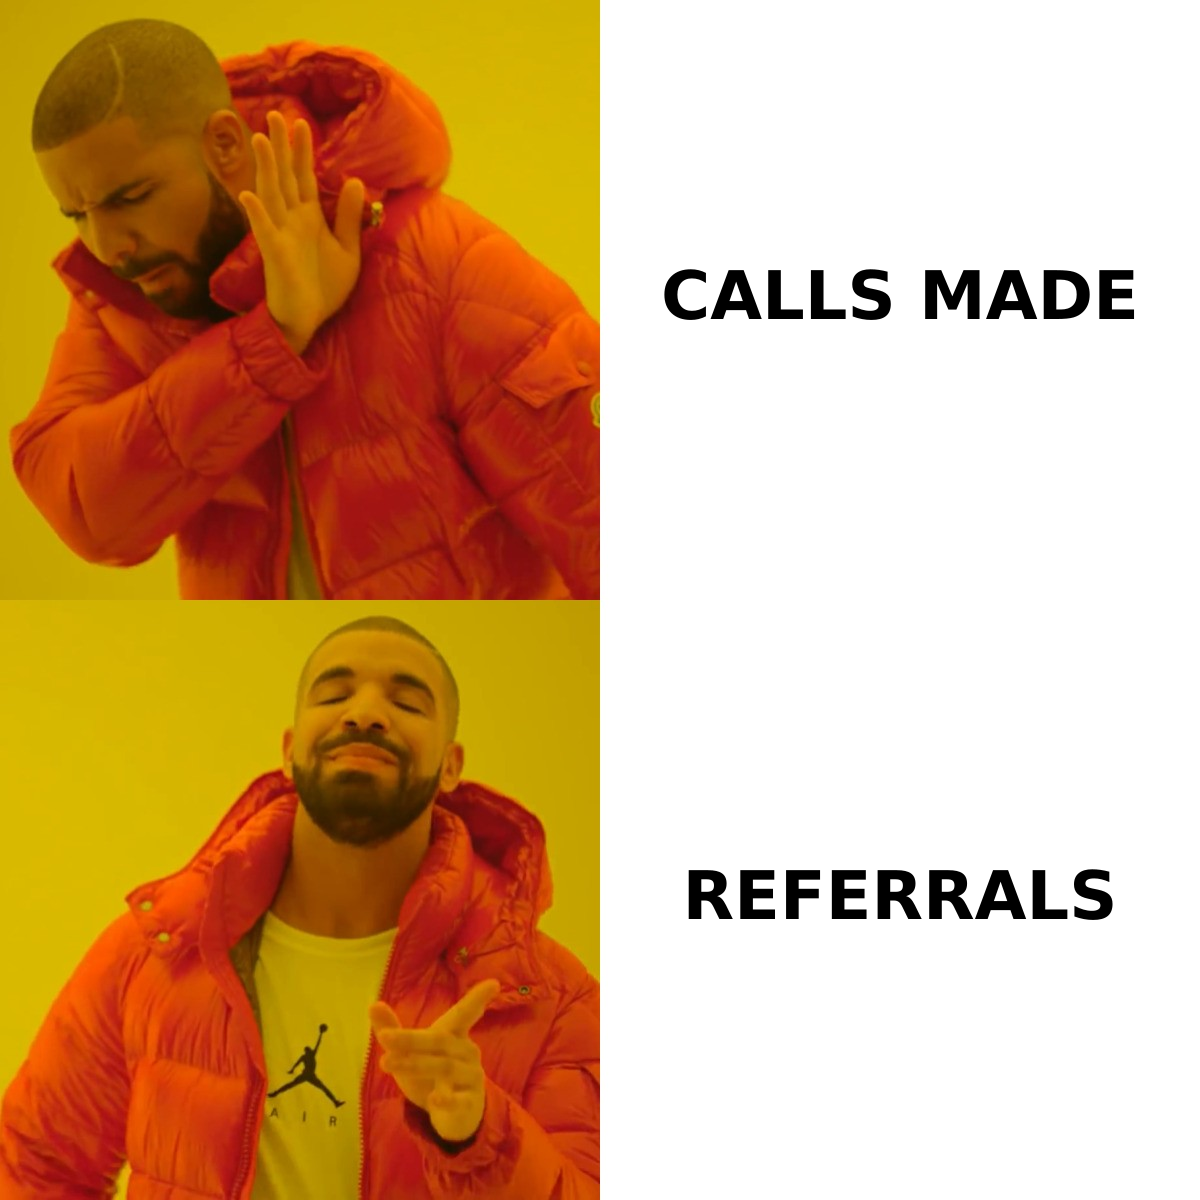
The bottom row matters more than people admit. If your motion is genuinely relationship-led, an activity dashboard will make your best reps look lazy and your worst reps look like stars. That misalignment is how good account managers get managed out.
Which KPIs for relationship selling actually predict revenue?#
Twelve metrics, grouped by what they tell you. You do not need all twelve. Pick three to five per group based on your motion.
Group 1: Relationship depth#
- Multi-threading depth — average number of distinct contacts engaged per open opportunity. Below 3, your deal dies when your champion changes jobs. Target 4–6 for enterprise, 2–3 for mid-market.
- Buying committee coverage % — of the roles you know are involved (economic buyer, technical evaluator, end user, procurement), what percentage have you actually spoken to? Coverage is stricter than depth because it checks who, not just how many.
- Contact freshness rate — percentage of account contacts verified in the last 90 days. This is the least glamorous KPI on the list and the one most likely to be quietly destroying the other eleven.
- Relationship half-life — the median time before a logged champion stops responding. Tracks the churn of your human graph, not your revenue graph.
Group 2: Trust signals#
- Inbound-to-outbound message ratio per account. When a customer starts initiating more threads than you do, the relationship has flipped from sales to advisory. Track the crossover date.
- Reference willingness rate — percentage of closed-won accounts that agree to act as a reference within six months. Low single digits means you sold well but served poorly.
- Referral-sourced pipeline % — percentage of new pipeline value originating from an existing customer or contact introduction. This is the single cleanest proxy for relationship health, because nobody refers a vendor they merely tolerate.
- Response rate to non-selling touches. Send something with no ask — a relevant benchmark, an intro, a warning about a regulation. Measure replies. A healthy book sits above 25%; transactional books sit near zero.
Group 3: Expansion and retention#
- Net revenue retention (NRR) — the lagging truth. Anything under 100% means your relationships aren't compounding.
- Expansion revenue per relationship-year — total upsell/cross-sell dollars divided by the number of years the relationship has existed. Normalizes for tenure so your oldest accounts don't flatter the number.
- Logo retention by champion continuity. Split renewals into accounts where your primary champion stayed vs. left. The gap is the exact dollar value of your multi-threading deficit.
Group 4: Efficiency#
- Cost per relationship-sourced dollar — fully loaded cost of the account team divided by revenue sourced through relationships. Compares directly against your blended CAC and settles the "is this motion worth it" argument with a number instead of a vibe.
How do these KPIs compare to standard sales metrics?#
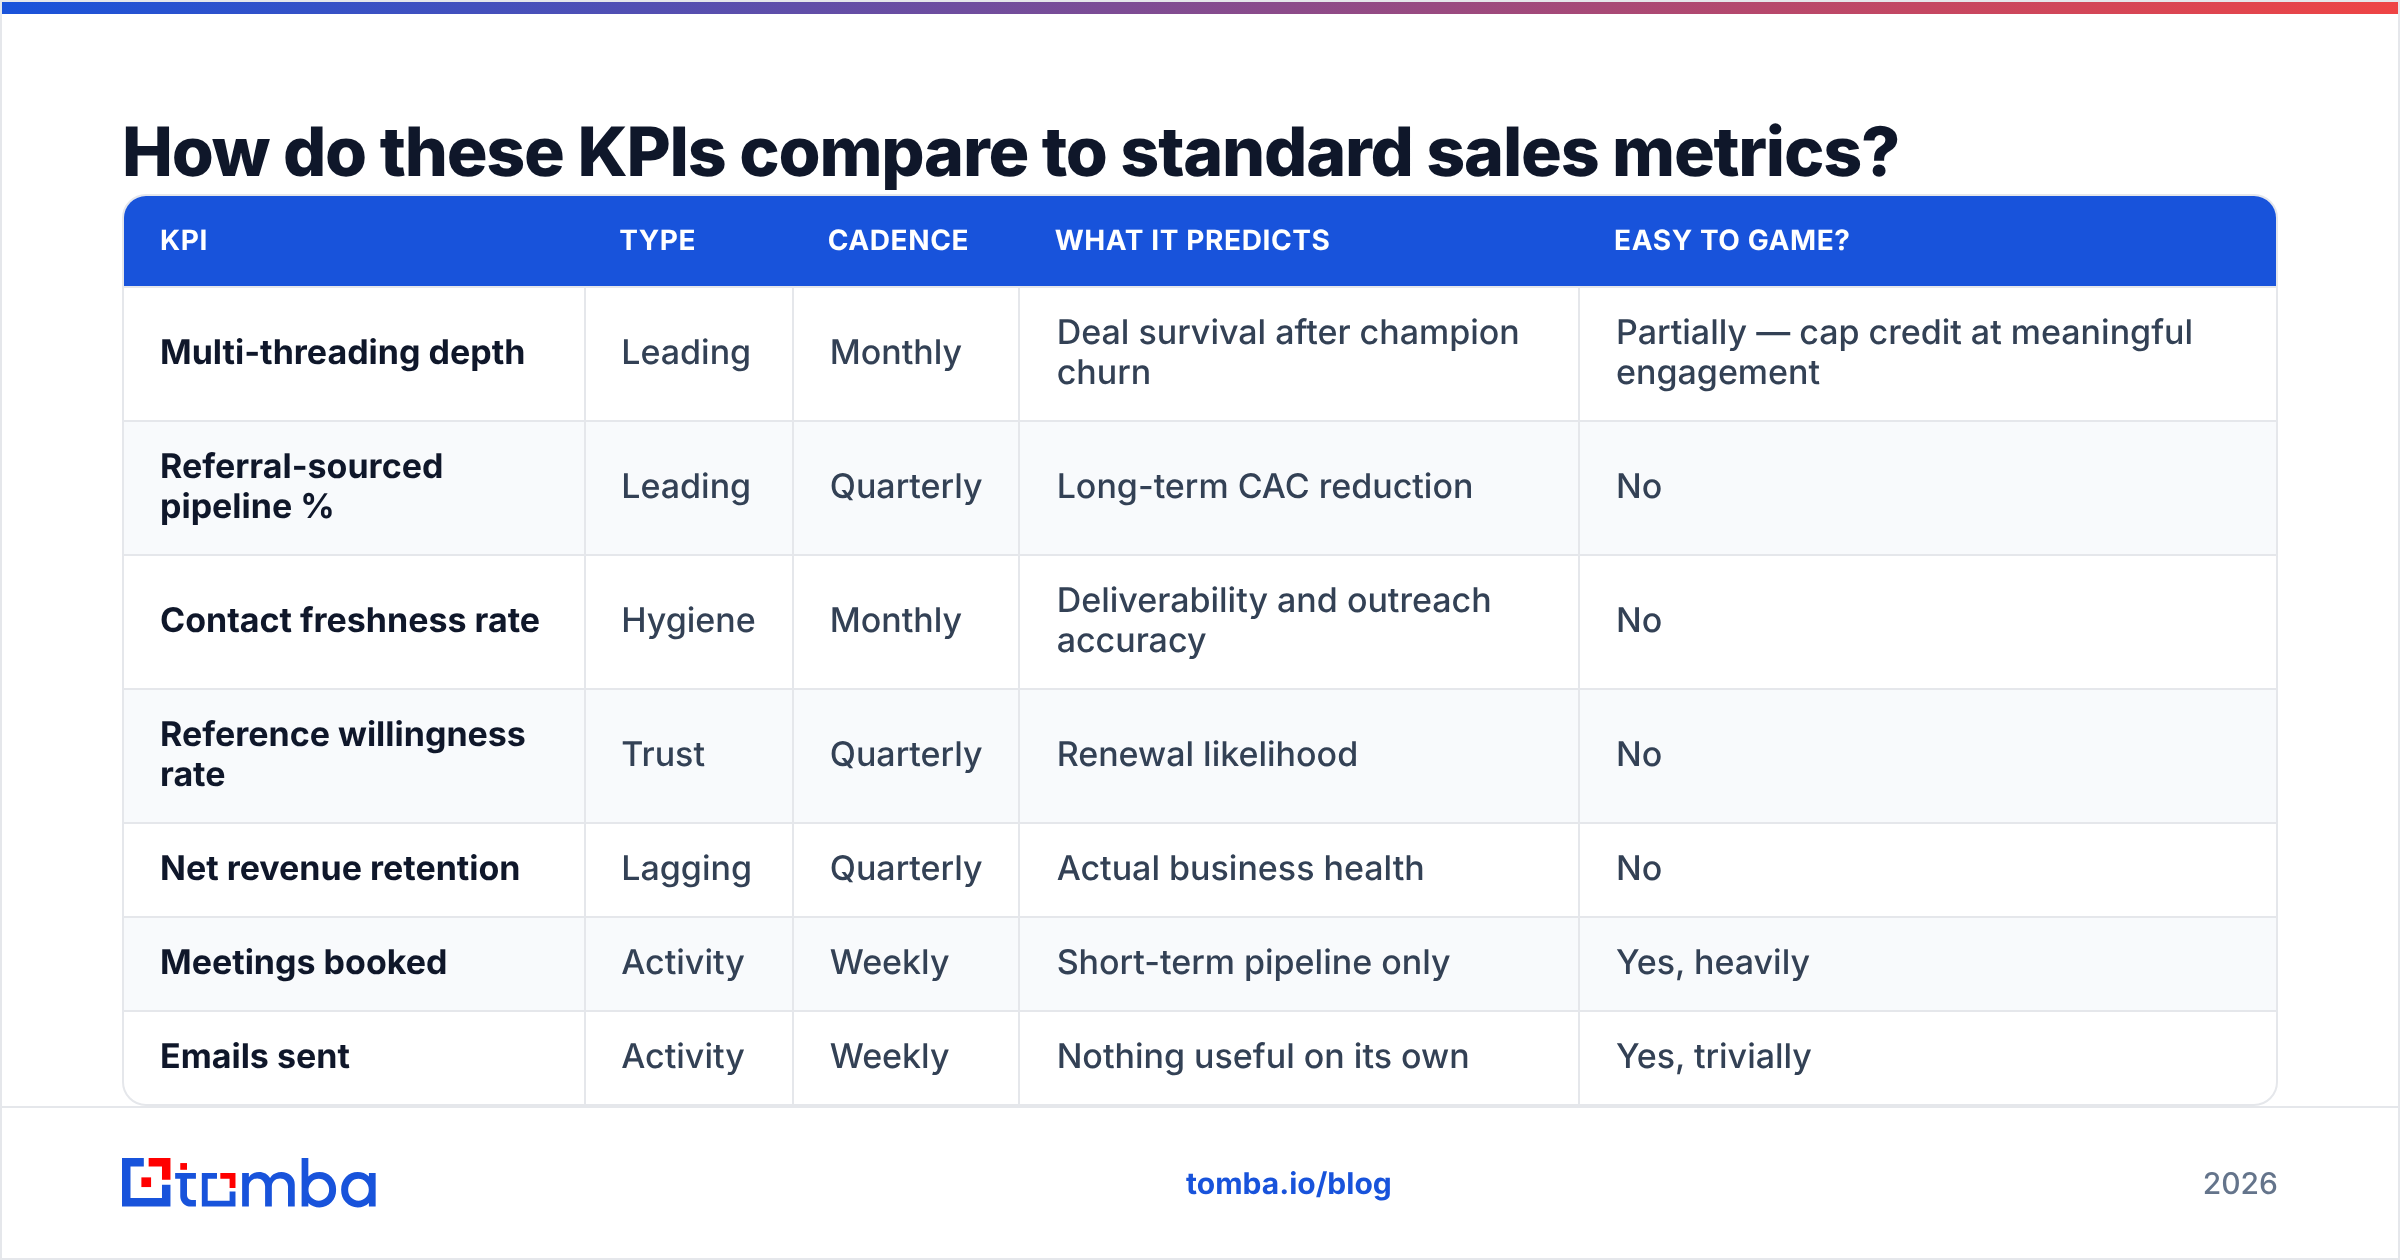
Side by side, with the thing each one actually tells you:
| KPI | Type | Cadence | What it predicts | Easy to game? |
|---|---|---|---|---|
| Multi-threading depth | Leading | Monthly | Deal survival after champion churn | Partially — cap credit at meaningful engagement |
| Referral-sourced pipeline % | Leading | Quarterly | Long-term CAC reduction | No |
| Contact freshness rate | Hygiene | Monthly | Deliverability and outreach accuracy | No |
| Reference willingness rate | Trust | Quarterly | Renewal likelihood | No |
| Net revenue retention | Lagging | Quarterly | Actual business health | No |
| Meetings booked | Activity | Weekly | Short-term pipeline only | Yes, heavily |
| Emails sent | Activity | Weekly | Nothing useful on its own | Yes, trivially |
| Expansion per relationship-year | Lagging | Annually | Account team effectiveness | No |
Notice the pattern: the harder a metric is to game, the slower it moves. That is not a flaw. It's why relationship selling KPIs belong on a quarterly business review, while activity metrics belong in a rep's own dashboard where nobody's comp depends on them.
For the broader framing on how retention-focused metrics roll into pipeline health, HubSpot's sales metrics library is a reasonable neutral reference, and Gartner's sales research covers the buying-committee data that underpins multi-threading targets.
Why does contact data quality decide whether these KPIs work?#
Because every relationship KPI on this list is computed from a contact record, and contact records rot at roughly 2–3% per month in B2B.
Run the arithmetic. If your CRM holds 10,000 contacts and 2.5% go stale monthly, a quarter of your relationship graph is fiction within a year. Your multi-threading depth reads 4.2 when the real number is 3.1. Your response rate to non-selling touches craters and you blame the copy, not the fact that a third of the addresses bounce.
The practical fixes, in order of impact:
- Re-verify quarterly, not annually. Run your active-account contacts through an email verifier every 90 days and flag the failures for re-sourcing rather than deletion. Deleting destroys your relationship history.
- Re-source before you re-engage. When a champion leaves, you need their replacement before your next touch, not after three bounces. A domain search over the account's domain surfaces who now holds the relevant titles.
- Instrument job changes as an event, not a discovery. A departed champion at a happy account is a warm lead at their new company. Most teams find out six months late.
- Enrich once, at the account level. Filling in seniority, department and direct-dial data via data enrichment is what makes buying-committee coverage computable at all — you can't measure coverage of roles you never recorded.
- Keep the bulk path cheap. Quarterly re-verification across a few thousand contacts is only sustainable if it's a bulk operation, not a rep's manual afternoon.

The honest version of this section: relationship KPIs fail for boring operational reasons far more often than strategic ones. Nobody's relationship strategy was wrong. Their contact table was.
How do you instrument each KPI without adding CRM admin work?#
Rep-entered data is the tax that kills relationship measurement programs. Every field you ask a rep to fill manually is a field that will be 60% populated within two quarters. Design around that.
Derive, don't ask. Multi-threading depth should come from email and calendar sync, counting distinct external participants with at least two two-way exchanges. No rep input required. Buying-committee coverage needs one enrichment call to map titles to roles, then it computes itself.
Use a threshold, not a checkbox. "Engaged contact" should mean something falsifiable — two-way exchange, or a meeting attended — not a rep ticking a box. Thresholds survive audits; checkboxes don't.
Automate the one field you genuinely need. Referral source is the exception: you cannot derive "Dana at Acme introduced us" from metadata. Make it a single required picklist on opportunity creation with an adjacent contact lookup. One field, enforced, beats fifteen optional ones.
Sample instead of censusing the soft stuff. Reference willingness and non-selling-touch response rate don't need full coverage. Sample 30 accounts a quarter. The trend is what matters, and a sample trend is more reliable than a census nobody completes.
Pipe verification results into the CRM automatically. Contact freshness should be a system-written field updated by your verification job via the Tomba API or a HubSpot integration, not a rep's judgment call about whether an address "seems right."
What does a good relationship selling scorecard look like?#
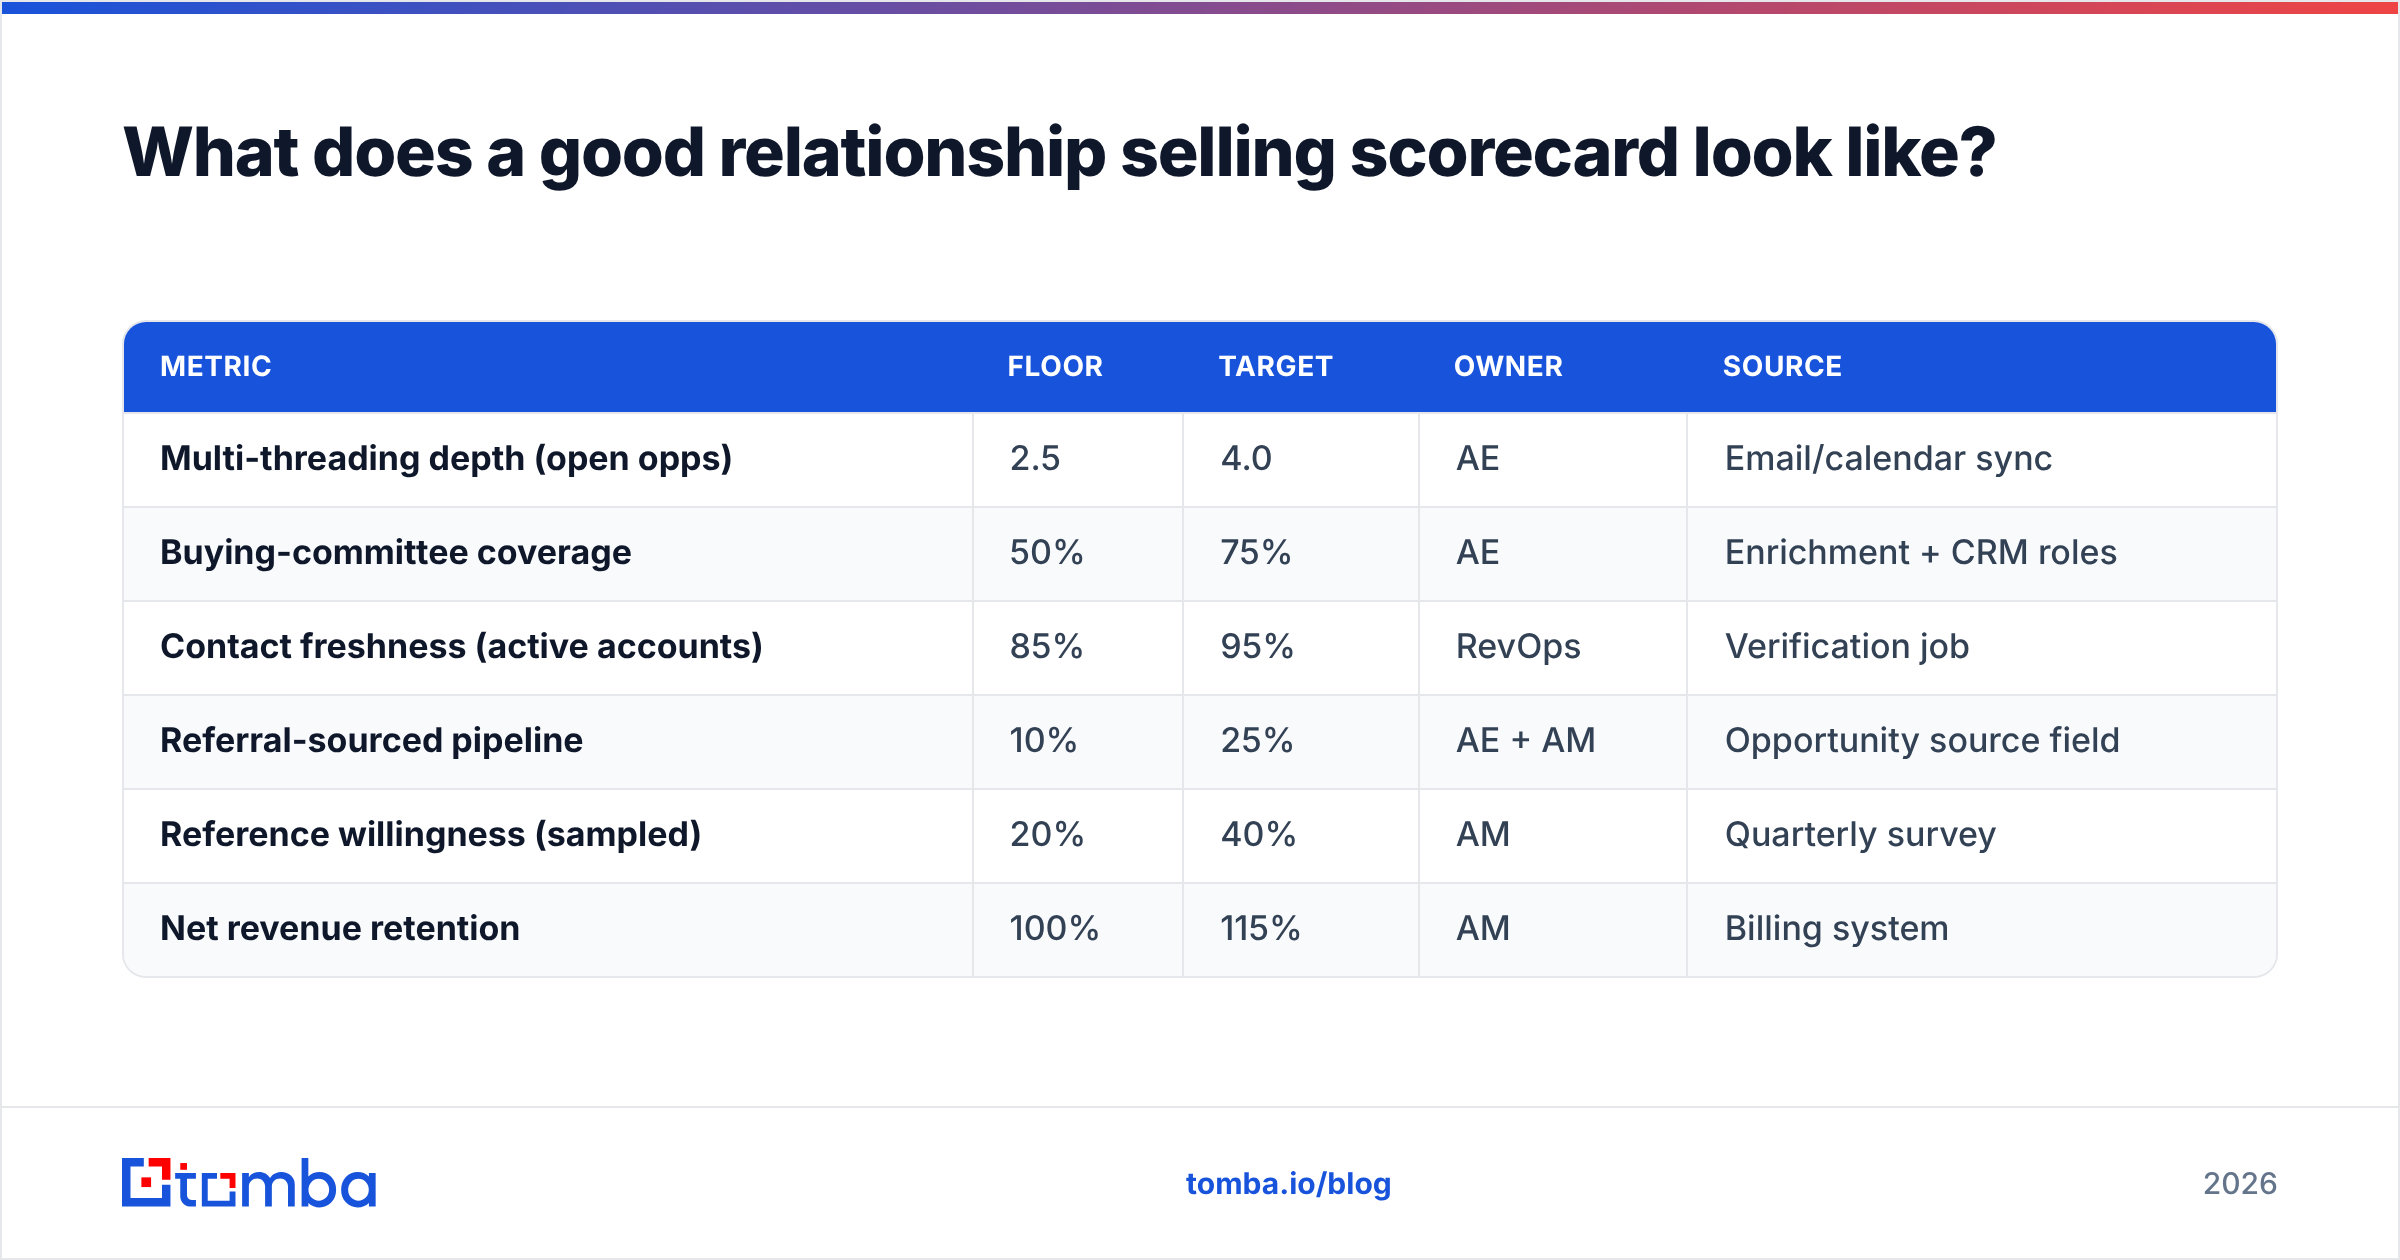
One page, four rows, quarterly. Here's a workable default for a mid-market B2B team:
| Metric | Floor | Target | Owner | Source |
|---|---|---|---|---|
| Multi-threading depth (open opps) | 2.5 | 4.0 | AE | Email/calendar sync |
| Buying-committee coverage | 50% | 75% | AE | Enrichment + CRM roles |
| Contact freshness (active accounts) | 85% | 95% | RevOps | Verification job |
| Referral-sourced pipeline | 10% | 25% | AE + AM | Opportunity source field |
| Reference willingness (sampled) | 20% | 40% | AM | Quarterly survey |
| Net revenue retention | 100% | 115% | AM | Billing system |
Two rules for running it:
Do not comp directly on the trust metrics. The moment reference willingness enters a commission plan, you get pressured customers and a corrupted number. Comp on NRR and expansion; coach on the rest.
Review the floors, not the targets, in your weekly. Accounts below floor are the coaching queue. Accounts above target are the case-study queue. Everything in between doesn't need a meeting.
When is relationship selling the wrong model to measure?#
Be honest about fit before you build the dashboard.
Relationship selling KPIs earn their keep when deal sizes exceed roughly $15–25K annually, sales cycles run past 60 days, and the buying committee has three or more people. Under those thresholds, the measurement overhead costs more than the insight returns, and a clean activity-plus-conversion dashboard serves you better.
They also break down in genuinely low-repeat categories. If a customer buys once and has no plausible expansion path, referral-sourced pipeline is the only relationship KPI worth tracking, and you should track it as a marketing metric rather than a sales one.
For a sanity check on how peers in your segment weight these, the review data on G2's sales software categories gives a rough sense of which motions cluster around retention versus acquisition metrics.
One last caveat that matters: relationship KPIs are easy to turn into surveillance. Counting distinct contacts engaged is fine. Scoring individual reps on the "warmth" of their customer conversations is not, and teams that try it lose trust internally faster than they build it externally. Measure the account. Coach the human.
Getting the data layer right#
Every metric here rests on knowing who is actually at the account right now — their role, their address, whether that address still works. That is a data problem before it is a sales problem, and it's the part most teams skip.
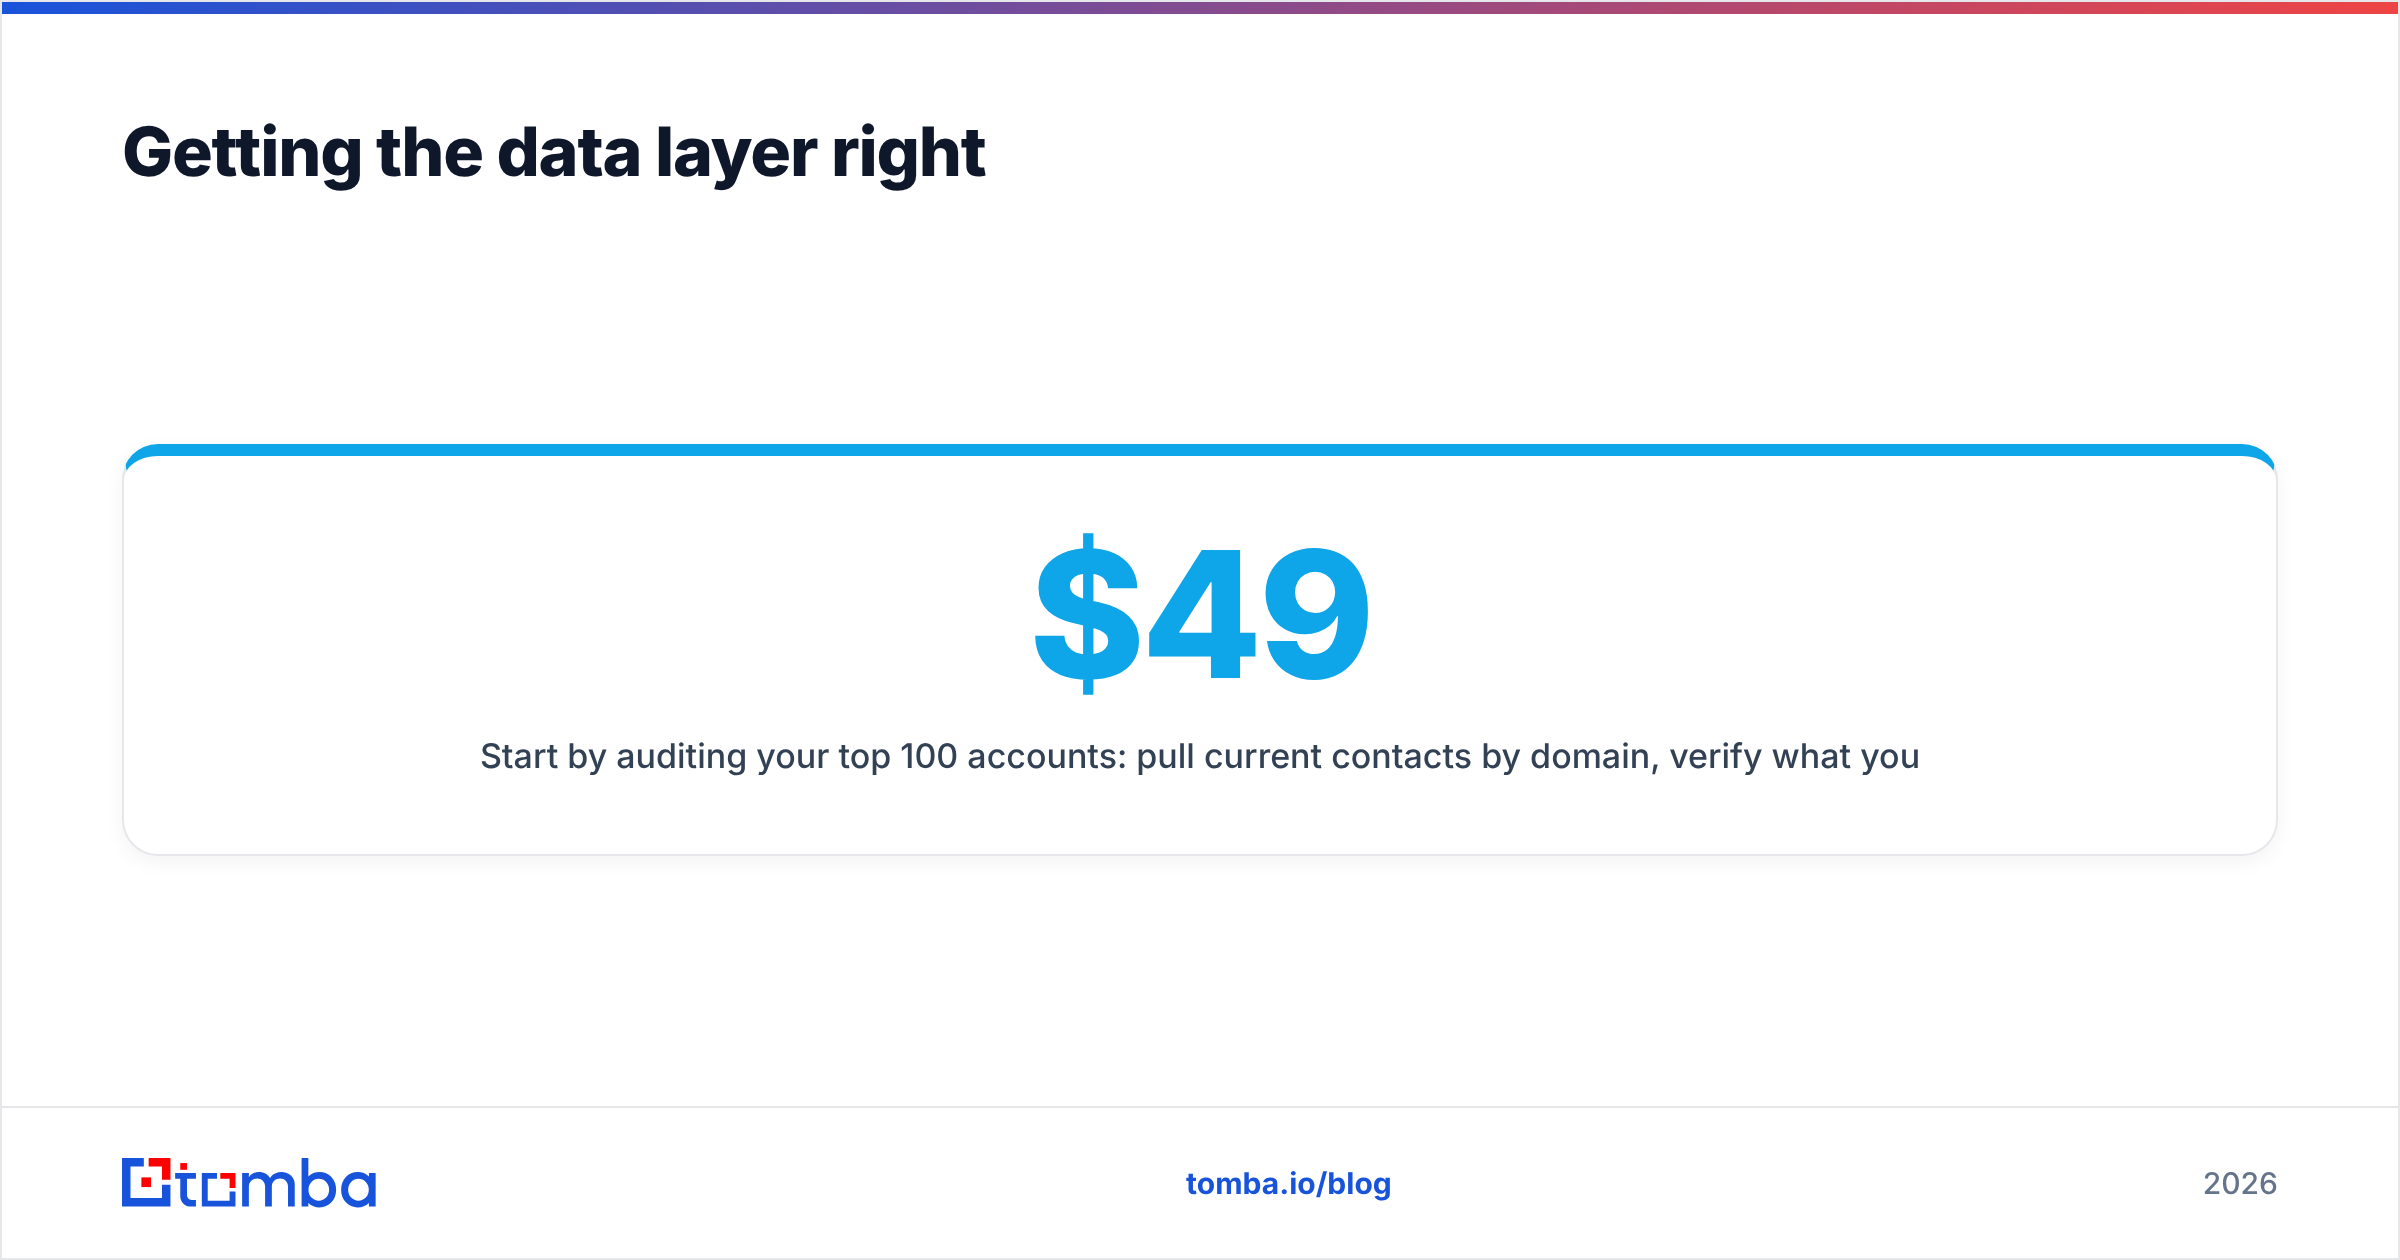
Start by auditing your top 100 accounts: pull current contacts by domain, verify what you have, and fill the gaps in the buying committee. Tomba Email Finder handles the sourcing side by domain, name or company, and the free tier gives you 25 searches a month to test the workflow on a handful of accounts before committing. Paid plans start at $49/mo (Starter), with Growth at $99/mo and Pro at $249/mo if you need bulk volume across a full book — full details on the Tomba pricing page.
Get the contact layer accurate, and the twelve KPIs above stop being estimates and start being decisions.
Related guides#
Ready to find emails that actually work?
Join 150,000+ professionals who stopped guessing and started sending. Free credits on signup — no credit card required.
Get the Tomba newsletter
Practical outbound tactics and product updates — once every two weeks.
About the author