Cold Email Open Rate Benchmark 2026: What Is Actually Normal
Vendors advertise 70% open rates. Real inboxes tell a different story. Here are the honest 2026 cold email open rate benchmarks, why bot opens inflate them, and the three metrics that actually predict pipeline.
TL;DR
- A realistic cold email open rate benchmark in 2026 is 35–50% for a clean, verified list — not the 70–80% screenshots you see on LinkedIn.
- Roughly 20–35% of your reported opens are machine opens: Apple Mail Privacy Protection, security scanners, and link-prefetchers firing your tracking pixel before a human sees anything.
- Open rate is now a directional health signal, not a KPI. Reply rate, positive reply rate, and bounce rate are the numbers that survive audit.
- The single biggest lever on open rate is list quality, not subject lines. A 4% bounce rate quietly kills the deliverability that makes opens possible.
- If your open rate is below 25% on a verified list, the problem is almost always domain reputation or targeting — not copy.
What is a realistic cold email open rate benchmark in 2026?#
Start with the honest number: 35–50% on a verified, well-targeted list sent from a warmed domain. Below 25% means something upstream is broken. Above 60% usually means you are counting robots.
That range is wider than most benchmark posts admit, because "cold email" covers wildly different things. A 40-person list of design partners you researched by hand behaves nothing like a 5,000-person blast to a scraped ICP.
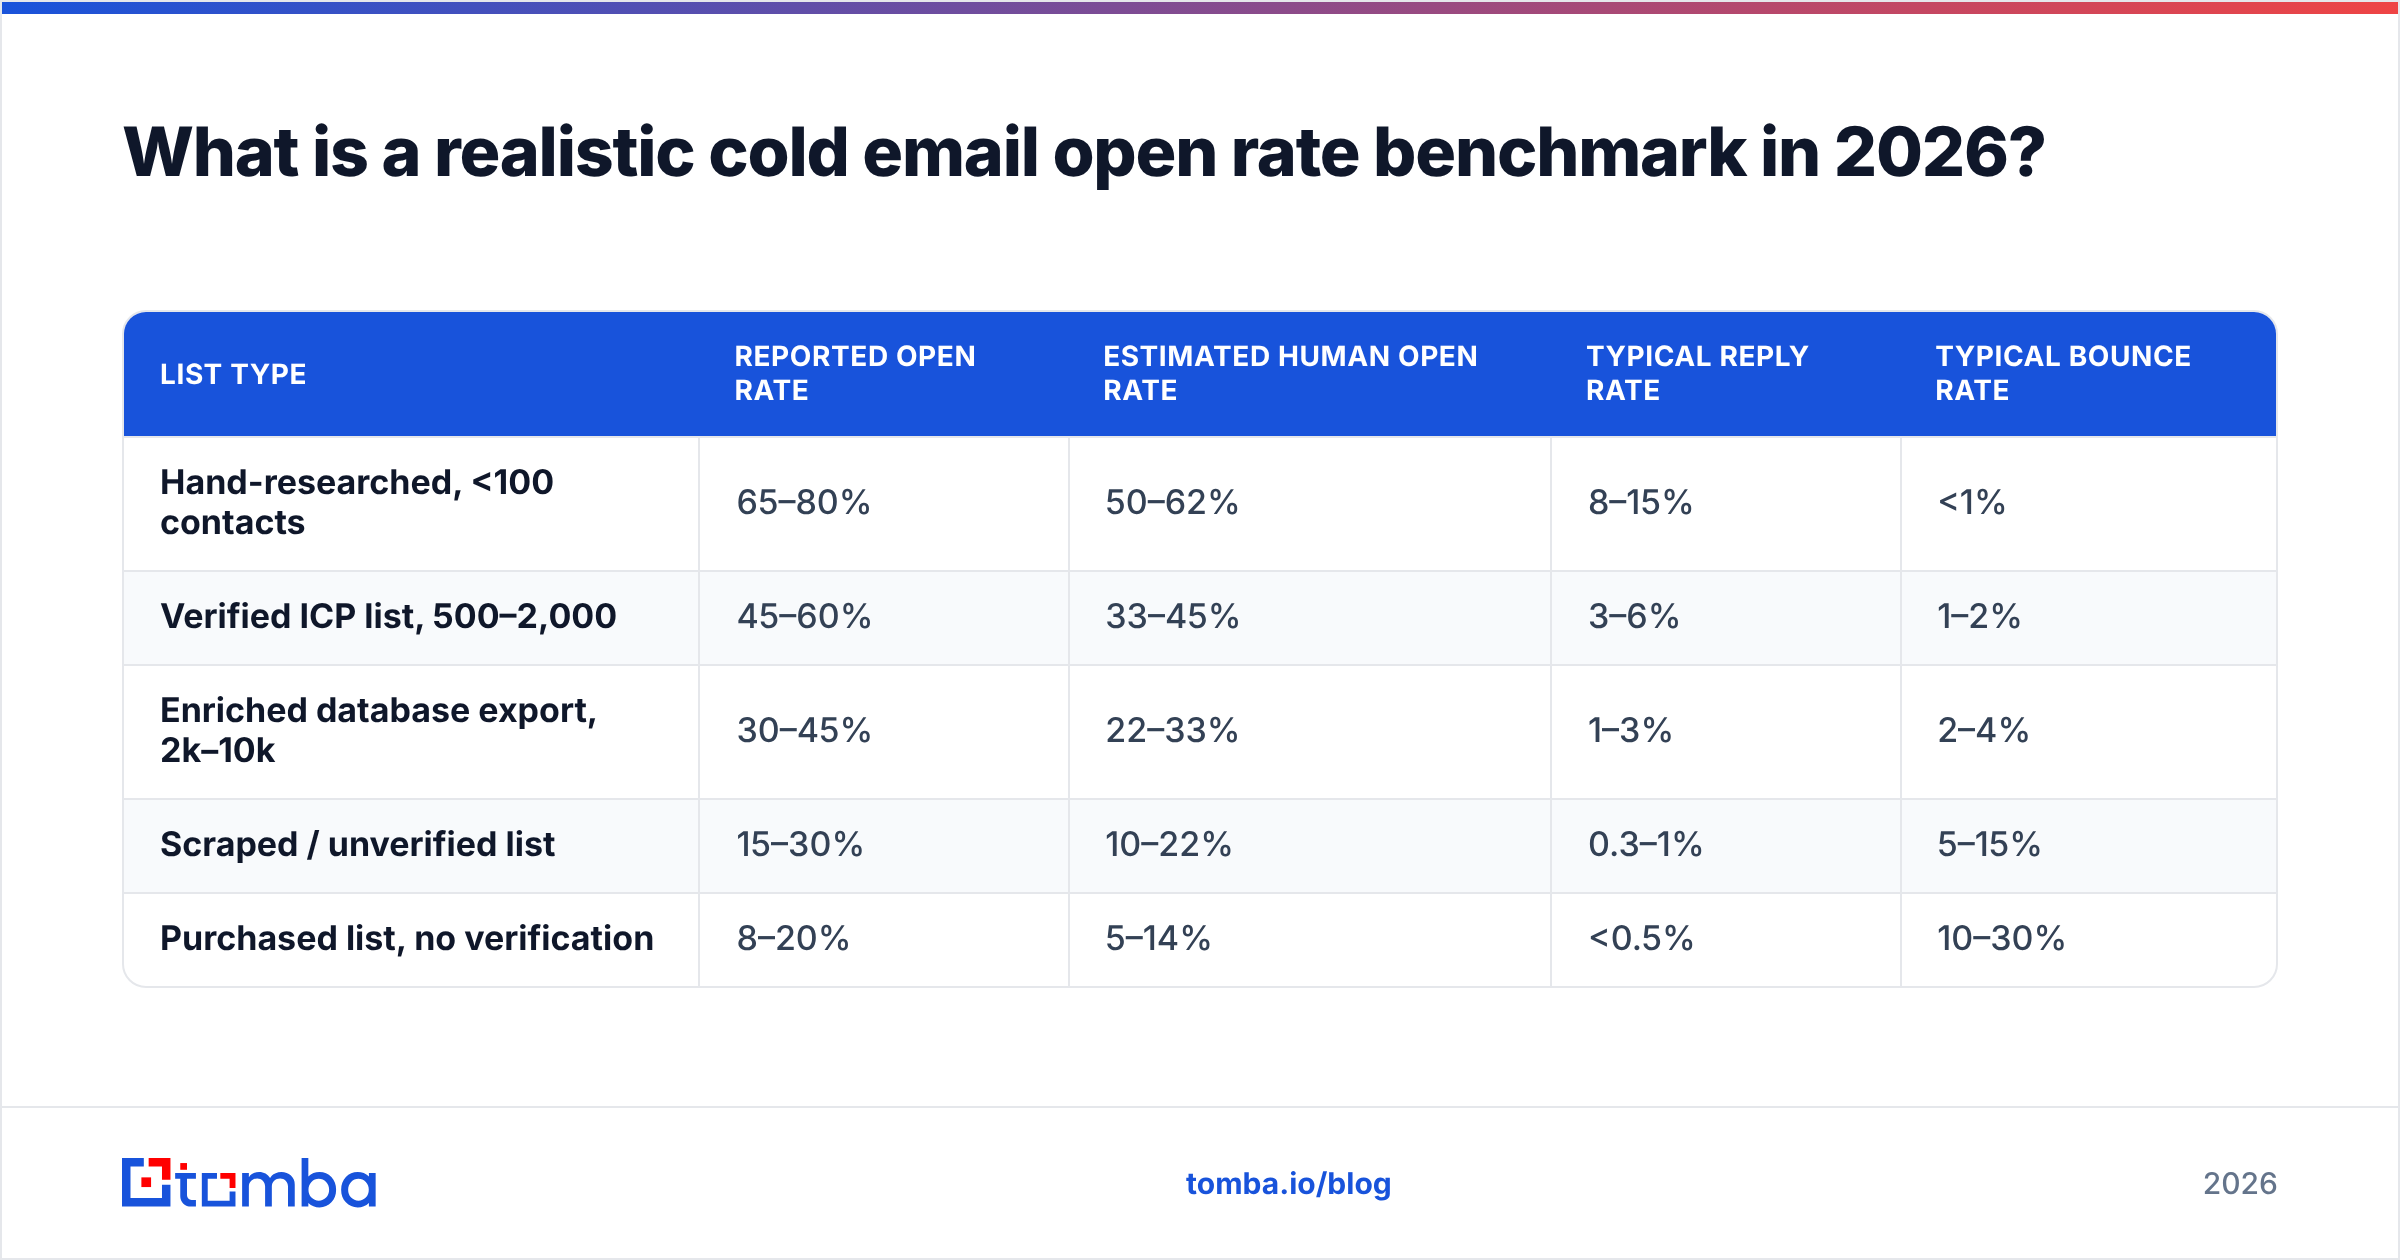
Here is the spread we see across list types, corrected for the machine-open problem described later:
| List type | Reported open rate | Estimated human open rate | Typical reply rate | Typical bounce rate |
|---|---|---|---|---|
| Hand-researched, <100 contacts | 65–80% | 50–62% | 8–15% | <1% |
| Verified ICP list, 500–2,000 | 45–60% | 33–45% | 3–6% | 1–2% |
| Enriched database export, 2k–10k | 30–45% | 22–33% | 1–3% | 2–4% |
| Scraped / unverified list | 15–30% | 10–22% | 0.3–1% | 5–15% |
| Purchased list, no verification | 8–20% | 5–14% | <0.5% | 10–30% |
Notice what moves together. Open rate and bounce rate are not independent variables — they are two readings of the same underlying thing, which is whether the addresses on your list are real, current, and owned by someone who plausibly wants to hear from you.
The gap between "reported" and "estimated human" is where most benchmark arguments come from. One team says 62%, another says 34%, and both are looking at the same inbox.

Why are open rates inflated, and by how much?#
Because a pixel does not know who fetched it.
An open is recorded when a 1×1 transparent image hosted on your sending platform's server gets requested. Any client that fetches that image — human or not — logs an open. Since 2021, several categories of non-human clients have been fetching it constantly.
The four sources of phantom opens:
- Apple Mail Privacy Protection (MPP). Apple pre-loads remote images through a proxy for every message delivered to Apple Mail, regardless of whether the user ever taps it. Apple Mail is roughly half of consumer email opens and a meaningful share of B2B iPhone users. Every one of those messages registers as opened, immediately, with a spoofed location.
- Security gateways. Mimecast, Proofpoint, Barracuda, and Microsoft Defender for Office 365 detonate links and load images in a sandbox before delivery. Your pixel fires. Your links get clicked. Nobody read anything.
- Link prefetchers. Gmail's image proxy caches remote images on delivery for some configurations. Browser prefetch and corporate DLP tools do the same.
- Your own tooling. Preview panes, mobile notification previews, and your teammate checking the sequence in a test inbox all count.
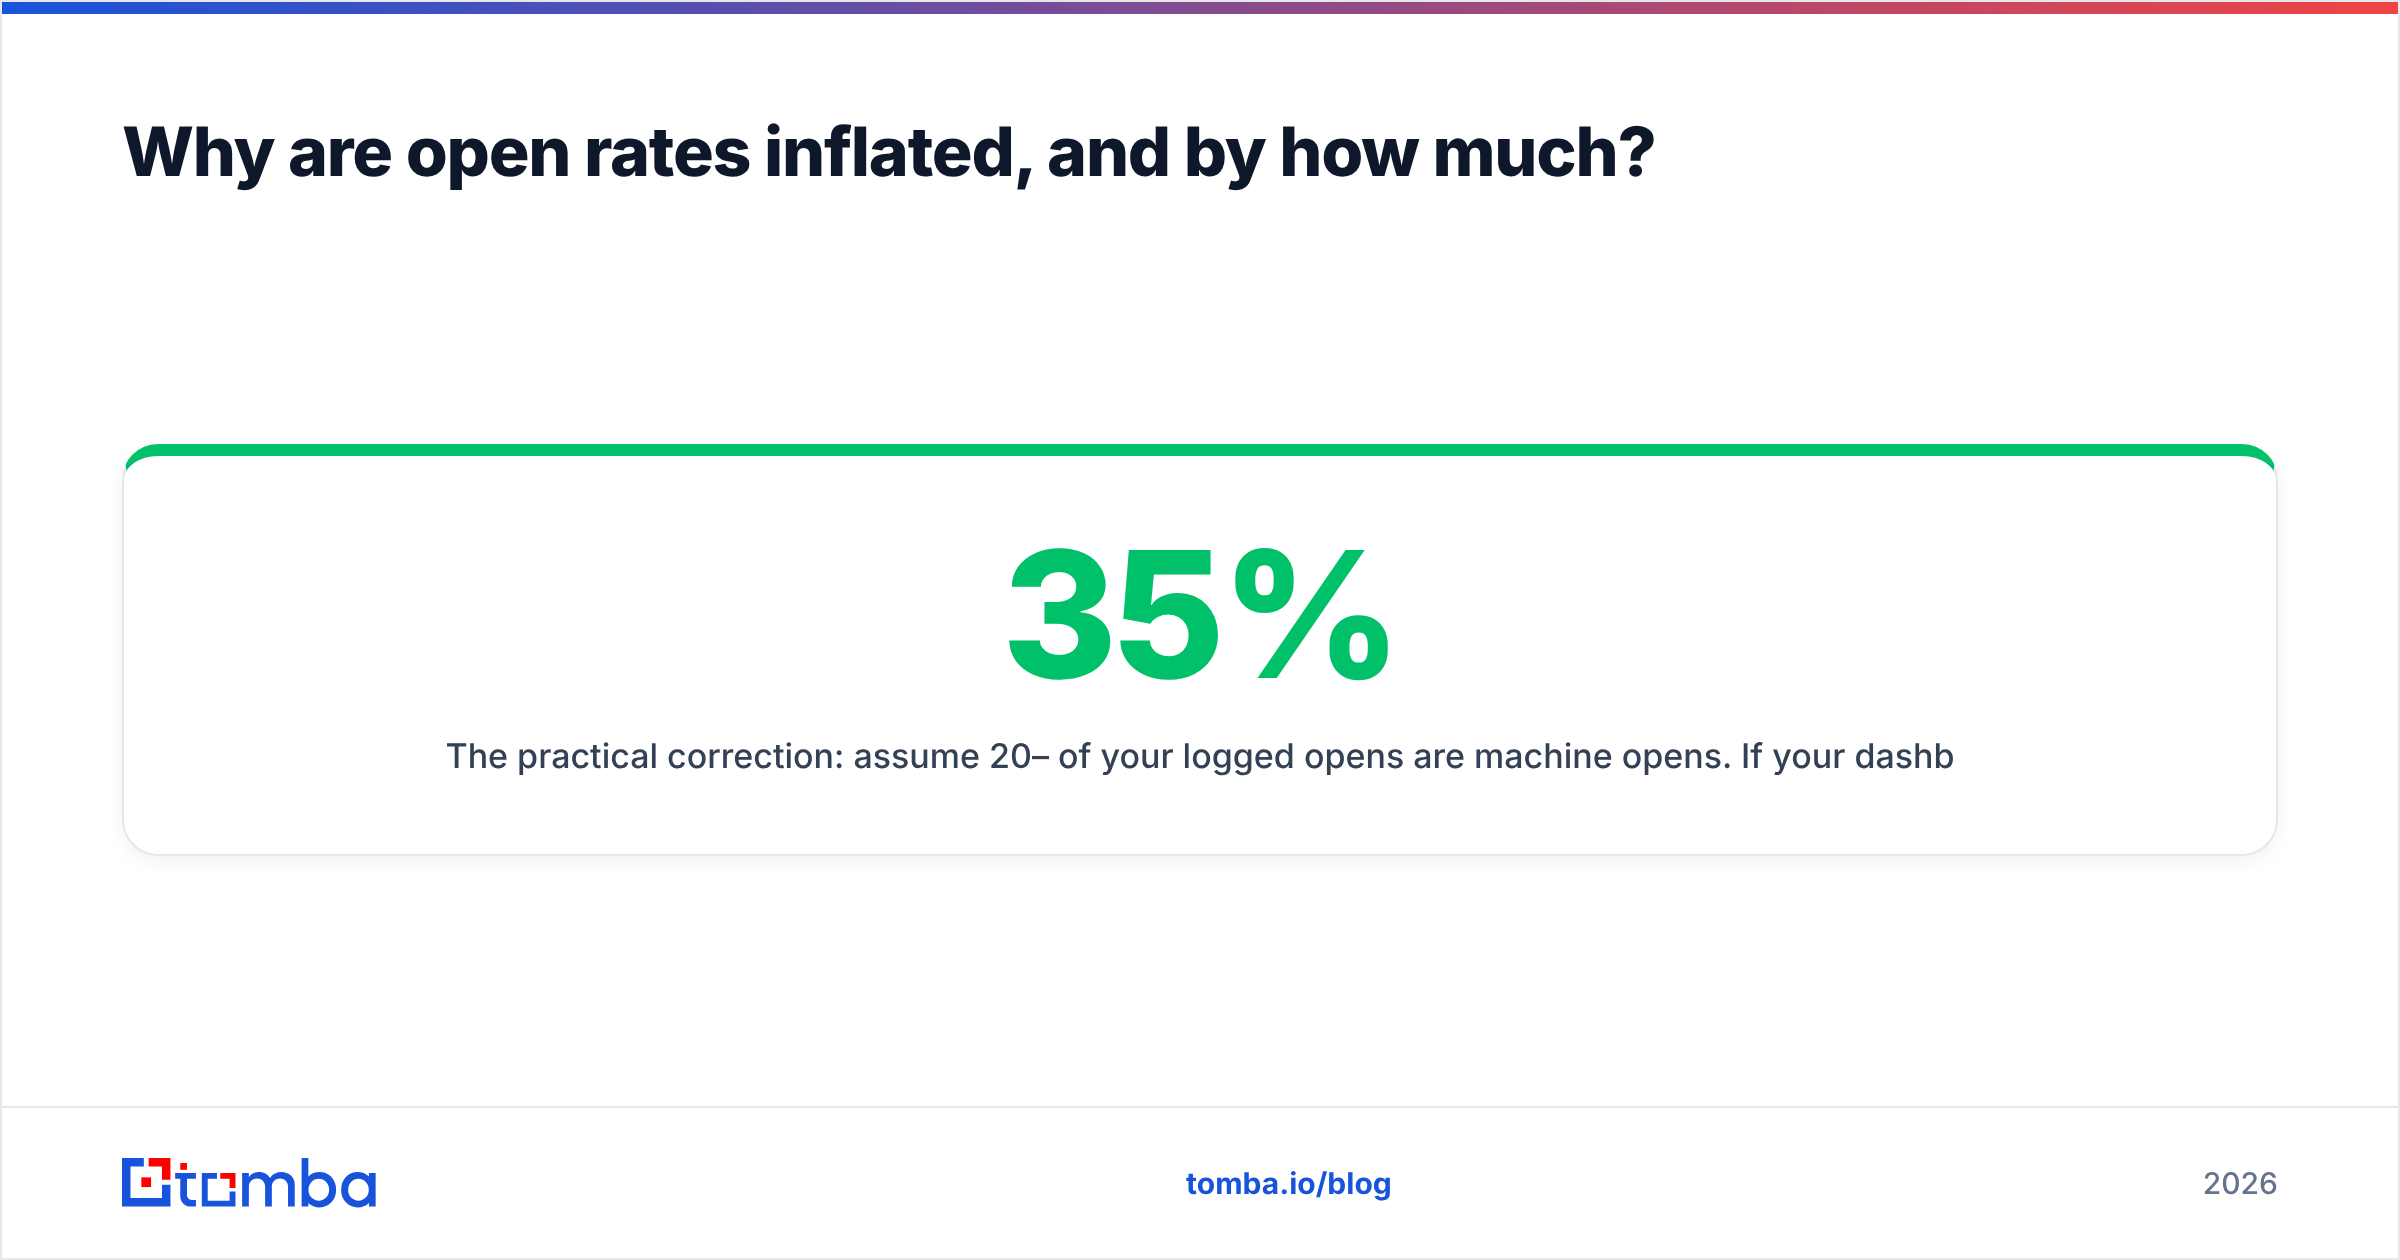
The practical correction: assume 20–35% of your logged opens are machine opens. If your dashboard says 60%, your realistic human open rate is somewhere around 40–48%. If it says 85%, you have a heavily Apple-weighted list and the number means almost nothing.
The open rate metric was always an approximation. MPP turned it into a proxy for "how many of your recipients use iPhones."
Is open rate still worth tracking at all?#
Yes — as a relative signal, never as an absolute one.
Open rate is still the fastest early-warning system for deliverability collapse. When a warmed domain drops from 45% to 12% in a week, nothing about your subject lines changed. Something about your sending reputation did. That drop is real and actionable even though the 45% was never a true number.
Use it this way:
- Compare a campaign to itself over time. Same list source, same domain, same tracking setup. A 15-point week-over-week drop is a fire.
- Compare A/B variants within a single send. Bot noise applies roughly evenly to both arms, so the delta between subject lines survives.
- Never compare across companies, industries, or benchmark reports. Different Apple mix, different tracking, different definitions of "sent."
What replaces it as a primary KPI:
- Reply rate — a human typed something. 3–6% is healthy on a verified cold list; 8%+ is strong.
- Positive reply rate — replies that are not "unsubscribe" or "wrong person." 30–50% of total replies is normal. This is the number your CRO cares about.
- Bounce rate — the leading indicator of everything. Keep it under 2%. Above 5% and mailbox providers start throttling you.
- Spam complaint rate — Google and Yahoo enforce a hard ceiling here. Their bulk sender guidelines put the threshold at 0.3%, with 0.1% as the target.
Reply rate cannot be faked by a security scanner. That is its entire advantage.
How do open rates break down by industry and company size?#
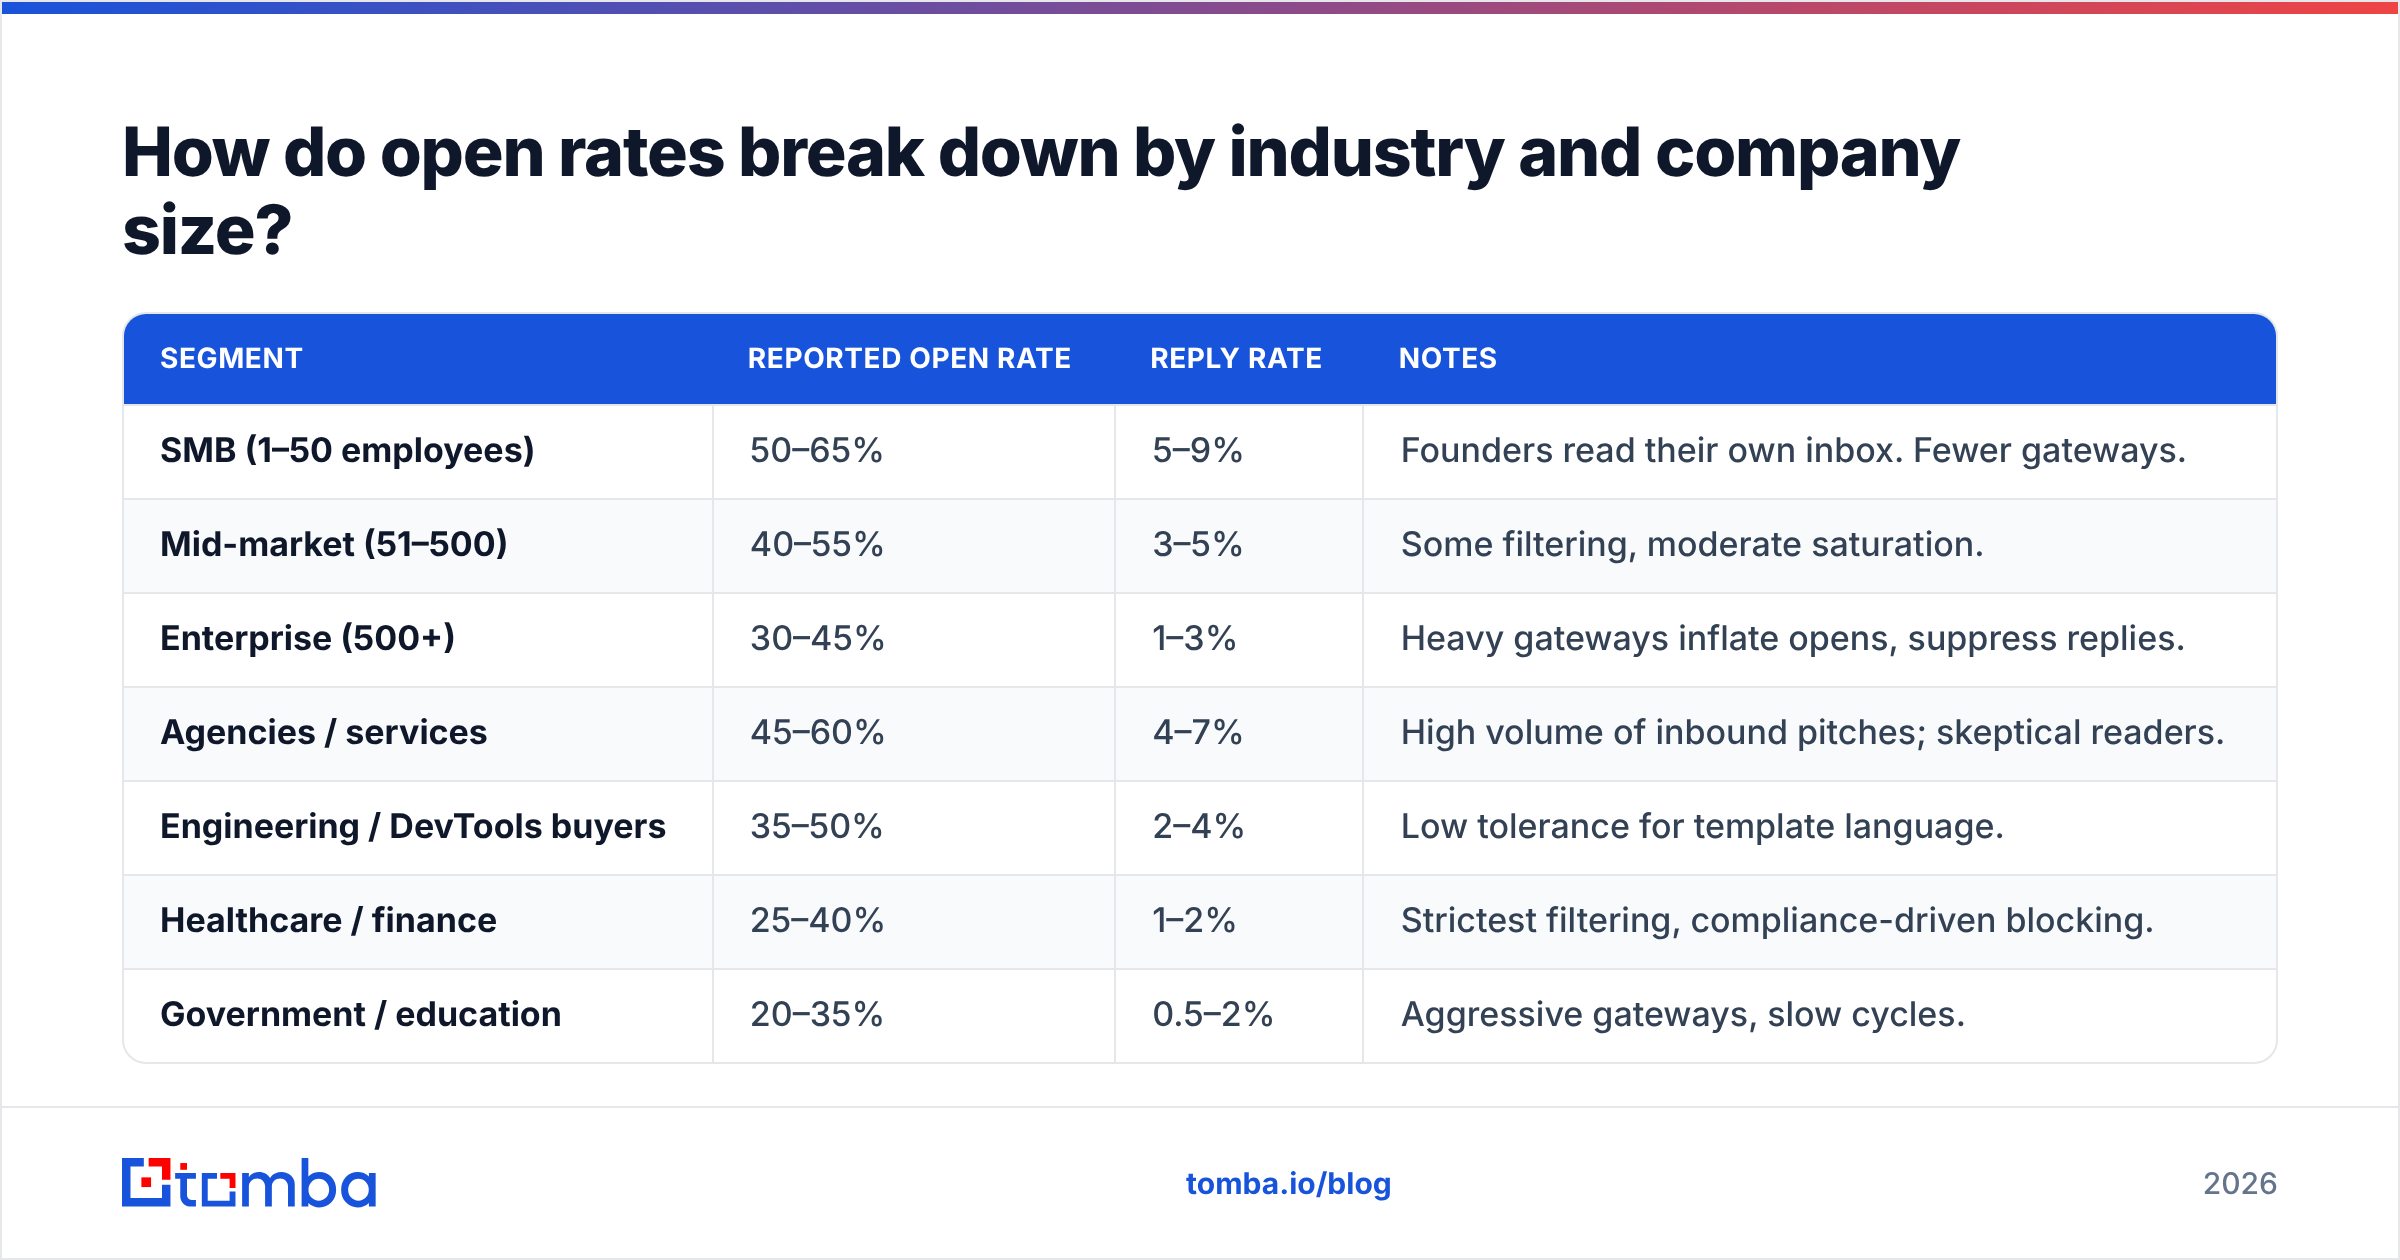
Segment matters more than most benchmark posts let on. The same email to a 20-person agency and a 20,000-person bank produces different numbers for structural reasons — enterprise inboxes sit behind more filtering, and enterprise contacts get more cold email.
| Segment | Reported open rate | Reply rate | Notes |
|---|---|---|---|
| SMB (1–50 employees) | 50–65% | 5–9% | Founders read their own inbox. Fewer gateways. |
| Mid-market (51–500) | 40–55% | 3–5% | Some filtering, moderate saturation. |
| Enterprise (500+) | 30–45% | 1–3% | Heavy gateways inflate opens, suppress replies. |
| Agencies / services | 45–60% | 4–7% | High volume of inbound pitches; skeptical readers. |
| Engineering / DevTools buyers | 35–50% | 2–4% | Low tolerance for template language. |
| Healthcare / finance | 25–40% | 1–2% | Strictest filtering, compliance-driven blocking. |
| Government / education | 20–35% | 0.5–2% | Aggressive gateways, slow cycles. |
The enterprise row is the most misread line in this table. A 45% "open rate" into a Proofpoint-protected enterprise is frequently worse than a 35% open rate into an SMB list — because a huge share of those enterprise opens are the gateway, not the buyer. Pair every open-rate reading with its reply rate before you draw a conclusion.
What actually moves open rate — and what does not?#
Ranked by measured impact, from a lot to a little:
- List quality. Invalid addresses bounce; bounces destroy sender reputation; bad reputation lands you in spam; spam placement means nobody opens. This is a chain, and it starts with whether the address exists. Moving a list from 8% bounce to 1% bounce routinely lifts reported opens 15–25 points. Nothing else comes close.
- Domain and inbox warmup. A domain sending 400 emails on day one from a fresh subdomain will be throttled or filtered. Ramp over 3–4 weeks. Model it with a warmup calculator rather than guessing.
- Authentication. SPF, DKIM, and DMARC are table stakes in 2026, not optional. A missing DMARC record at Google-scale volume gets you rejected outright, not deprioritized. Check your SPF record setup before you blame the copy.
- Sending volume per mailbox. 30–50 per mailbox per day is the sane ceiling for cold outbound. Scale by adding mailboxes, not by pushing one harder.
- Targeting relevance. People open emails from senders whose names or companies mean something to them. Relevance is upstream of subject lines.
- Subject line. Real, and worth testing — but it is a 3–8 point lever, not a 30-point one. Run it through a subject line tester and move on.
Most teams do this list backwards. They spend three weeks A/B testing subject lines on a list where one in twelve addresses does not exist.

How do you diagnose a low open rate?#
Work top to bottom. Stop at the first thing that is broken.
Step 1 — Check bounce rate first. If bounces exceed 3%, nothing below matters. Your list is the problem. Run the list through an email verifier and re-measure. Catch-all domains need separate treatment; a plain verifier returns "unknown" on them and you need a catch-all verifier to resolve those rather than gambling on them.
Step 2 — Check spam placement. Send a seed test to a spread of Gmail, Outlook, and corporate inboxes. If you are landing in Promotions or Spam, no subject line will save you. Look at authentication records, link count, image count, and whether your domain appears on any blocklist.
Step 3 — Check the deliverability trend. Google Postmaster Tools shows domain reputation, spam rate, and authentication pass rate for Gmail recipients. A "Low" or "Bad" domain reputation is a full stop. Fix it before sending another campaign.
Step 4 — Check volume and warmup age. New domain plus high volume equals filtering. It is not a mystery.
Step 5 — Only now, look at copy. Subject line, preview text, sender name. Sender name matters more than most people expect: Sarah at Acme outperforms Acme Sales Team consistently.
The uncomfortable truth is that steps 1 through 4 explain the large majority of low-open-rate cases, and step 5 is where the large majority of effort goes.
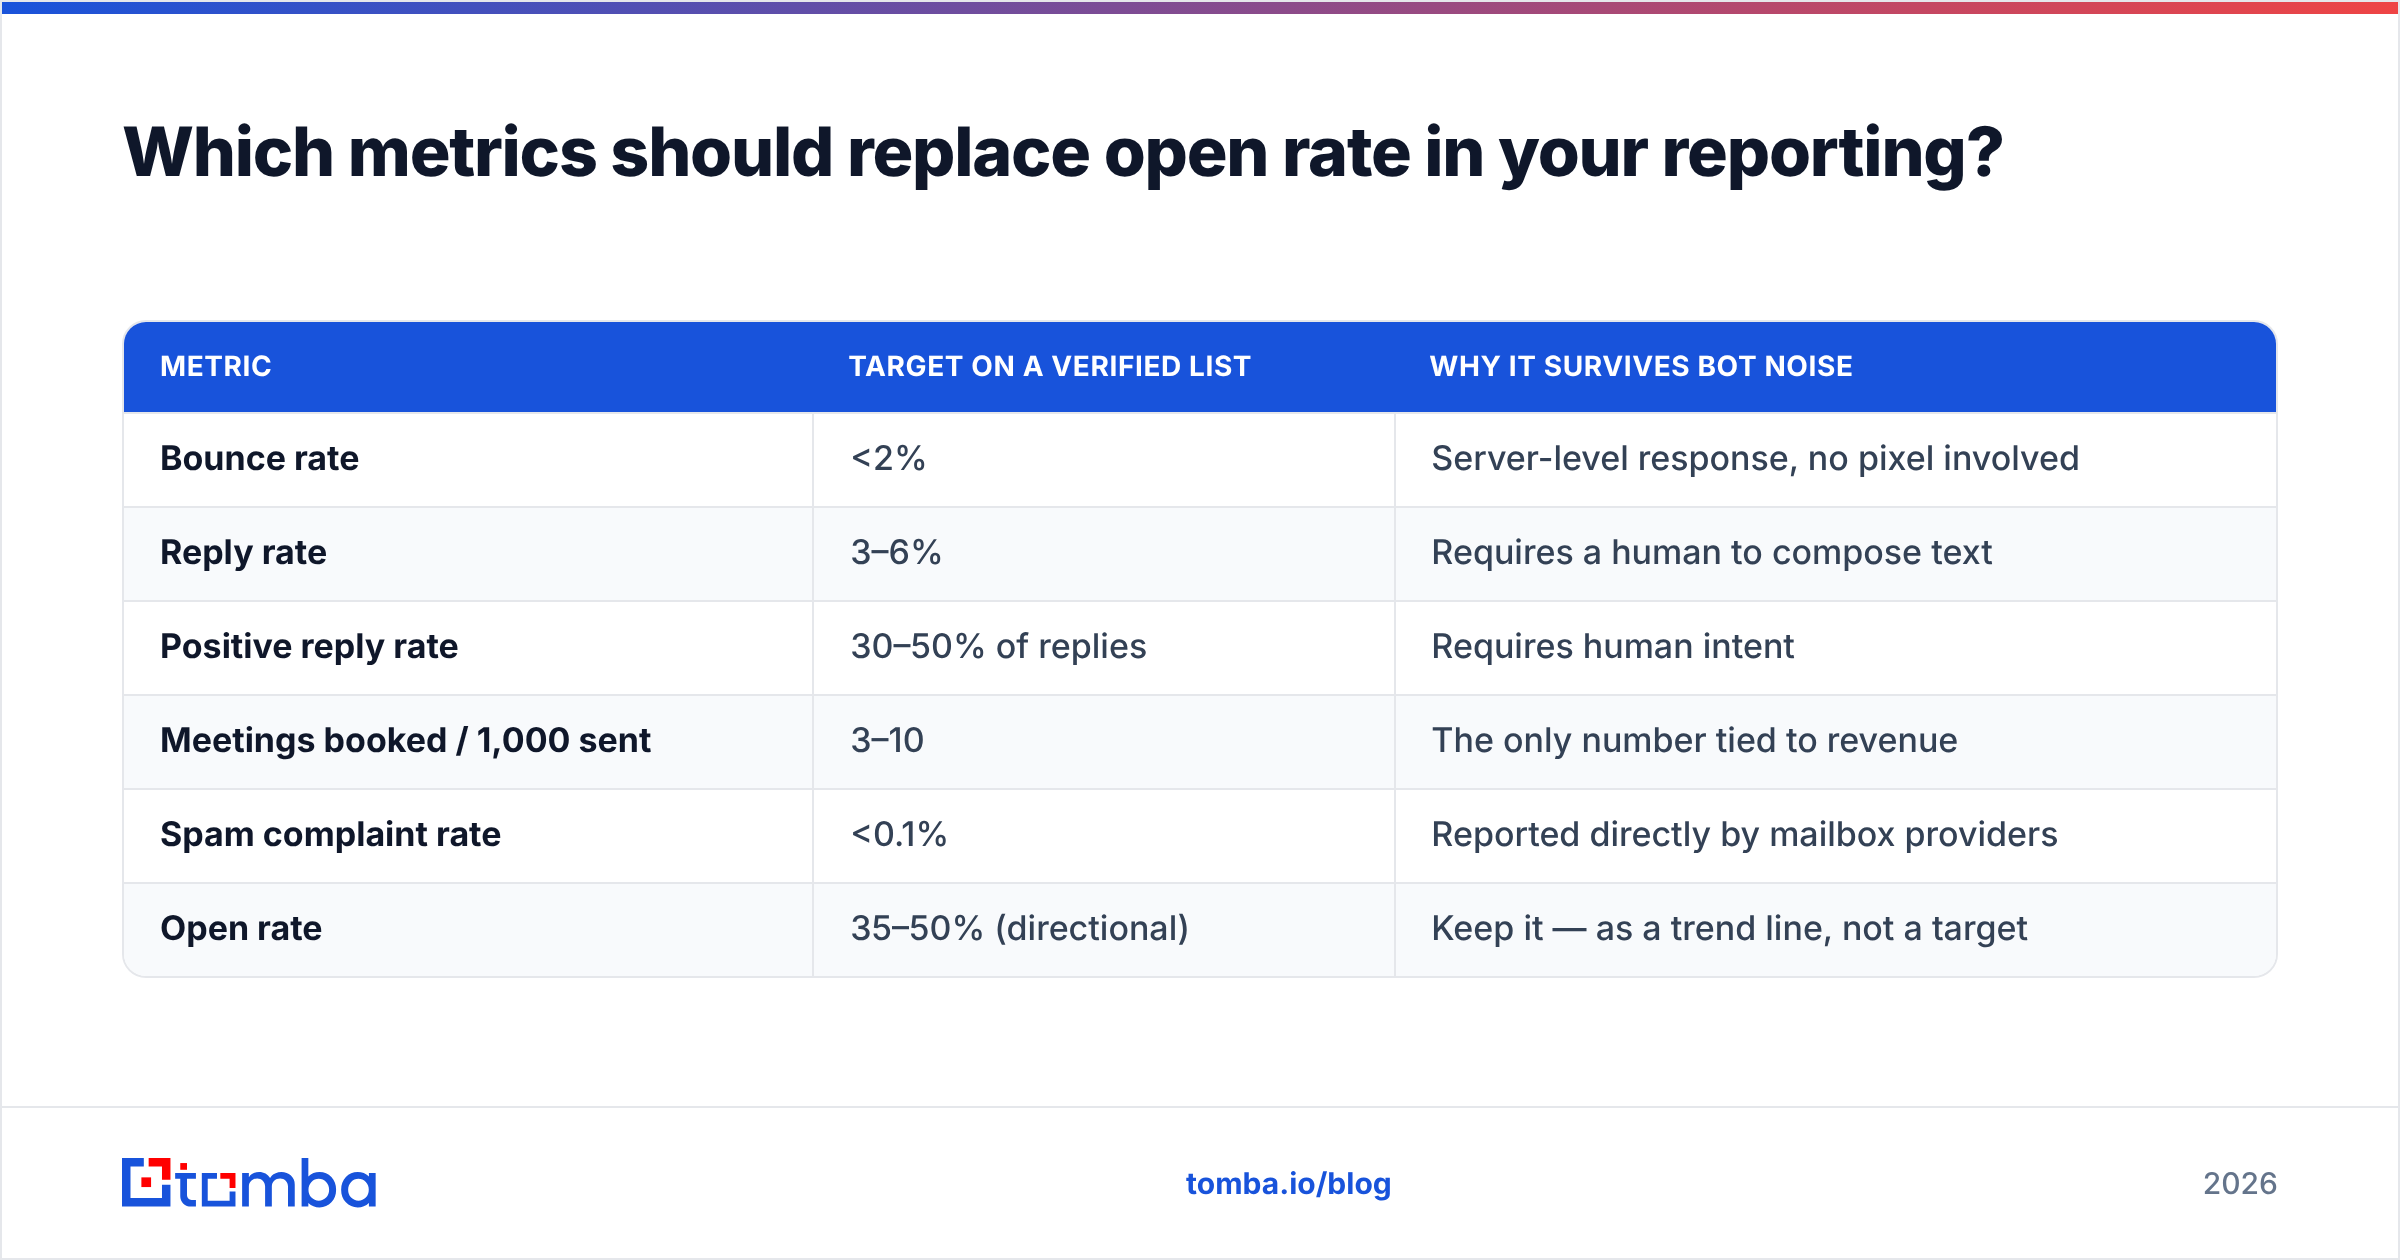
Which metrics should replace open rate in your reporting?#
Rebuild the dashboard around things a robot cannot do.
| Metric | Target on a verified list | Why it survives bot noise |
|---|---|---|
| Bounce rate | <2% | Server-level response, no pixel involved |
| Reply rate | 3–6% | Requires a human to compose text |
| Positive reply rate | 30–50% of replies | Requires human intent |
| Meetings booked / 1,000 sent | 3–10 | The only number tied to revenue |
| Spam complaint rate | <0.1% | Reported directly by mailbox providers |
| Open rate | 35–50% (directional) | Keep it — as a trend line, not a target |
Set the reporting cadence so that open rate appears as a small sparkline next to reply rate, not as the headline number in the weekly deck. The moment open rate becomes a goal, someone will optimize for it — usually by sending to more Apple users, which is a beautiful way to make a chart go up and pipeline go nowhere.
Vendors with strong verified B2B databases, including peers like BookYourData, have moved their own marketing toward reply and bounce metrics for exactly this reason. It is the direction the whole category is heading.
How do you build a list that hits the top of the benchmark range?#
Three things, in order.
Find the right addresses. Guessed patterns (first.last@, flast@) work maybe 60% of the time and bounce the rest. Use a real email finder that checks the pattern against known-good addresses on the domain rather than permuting names and hoping. For whole-company sweeps, a domain search returns every discoverable address on a domain with a confidence score attached to each.
Verify before you send, every time. Lists decay at roughly 2–3% per month — people change jobs, companies restructure. A list you verified in March is 10% stale by August. Re-verify anything older than 60 days.
Enrich enough to be relevant. Title, company size, and one specific trigger (funding, hiring, a shipped feature) is enough to write a sentence nobody else could have written. That sentence is what converts an open into a reply.
There is a well-documented relationship between list hygiene and inbox placement that HubSpot's email marketing research has tracked for years across both marketing and outbound sends: clean lists get delivered, delivered mail gets opened, and opened mail occasionally gets answered. The order is not negotiable.
What should you take away from all of this?#
Stop treating the cold email open rate benchmark as a scoreboard. Treat it as a thermometer.
A 45% open rate with a 1% bounce rate and a 4% reply rate is a healthy campaign. A 70% open rate with a 6% bounce rate and a 0.4% reply rate is a campaign that is being read by security software while your domain reputation burns. The first one builds pipeline. The second one builds a chart.
Get your bounce rate under 2%, watch reply rate as your primary signal, and use open rate the way a doctor uses a temperature reading — to notice when something has gone wrong, not to declare that everything is fine.
Fix the input, not the output. Every number in this post traces back to whether the addresses on your list are real. Tomba's Email Finder returns verified professional emails with a confidence score on each one, sourced from public web data rather than pattern-guessing — so your bounces stay under 2% and your open rate reflects humans instead of scanners. The free tier gives you 25 searches a month to test it against a list you already have; paid plans start at $49/mo. Compare the tiers on Tomba pricing and run your worst-performing list through it before you rewrite another subject line.
Related guides#
Ready to find emails that actually work?
Join 150,000+ professionals who stopped guessing and started sending. Free credits on signup — no credit card required.
Get the Tomba newsletter
Practical outbound tactics and product updates — once every two weeks.
About the author