Contact Rate vs Connect Rate: What Each Metric Really Means
Contact rate and connect rate sound interchangeable, but they use different denominators and answer different questions. Here's how to calculate each one, what good looks like in 2026, and which one you should actually optimize.
TL;DR
- Connect rate is a channel-level efficiency metric: live conversations divided by dial attempts. It answers "how well is my dialing working right now?"
- Contact rate is a coverage metric: unique prospects reached at least once, divided by unique prospects targeted. It answers "how much of my list did I actually touch?"
- The denominators are different — dials vs. people — so a rep can have a 4% connect rate and a 38% contact rate in the same week without any contradiction.
- Connect rate is the metric you fix with tactics (call windows, local presence, cadence). Contact rate is the metric you fix with data quality — bad numbers and dead inboxes cap it no matter how hard reps work.
- Track both. Optimizing connect rate alone rewards reps who redial the same easy contacts; optimizing contact rate alone rewards spray-and-pray.
What is connect rate?#
Connect rate is the percentage of your outreach attempts that produce a live human on the other end.
Think of it like a fisherman's cast-to-catch ratio. Every cast is an attempt. Every fish is a connect. If you cast 100 times and land 5 fish, your connect rate is 5% — and the number tells you something about your bait, your timing, and the water you chose, not about how many fish live in the lake.
In a phone context:
Connect rate = (live conversations ÷ total dial attempts) × 100The critical detail is the denominator. Attempts, not people. If you dial the same VP of Ops six times on Tuesday and reach her once, that's 1 connect from 6 attempts — a 16.7% connect rate on that contact. The metric is blind to how many distinct humans are involved.
Connect rate is also channel-specific. Email doesn't really have a connect rate in the phone sense; the closest analogue is reply rate. Most teams reserve "connect rate" for outbound calling and use it as a live diagnostic — if the number drops from 6% to 2% overnight, something broke: your caller ID got flagged, your dialer changed area codes, or you started calling at 4:45 p.m. on Fridays.
What is contact rate?#
Contact rate is the percentage of the people on your target list that you actually reached, at least once, through any channel.
Contact rate = (unique prospects reached ÷ unique prospects targeted) × 100Same fisherman, different question: out of the 200 fish you knew were in that lake, how many did you get a line in front of?
Contact rate is a coverage metric. It's account-based and channel-agnostic. If you reached a prospect via a picked-up call, an email reply, or a LinkedIn response, they count as contacted. If you burned 14 dials and 6 emails on someone and got nothing back, they count as zero — the effort doesn't earn partial credit.
This is why contact rate is the metric that exposes data problems. A disconnected phone number, a role that left the company eight months ago, or an email that hard-bounces will never convert into a contact, no matter how many attempts you throw at it. Sales leaders who watch only connect rate often miss that 30% of their list was structurally unreachable from day one.
Contact rate vs connect rate: what's actually different?#
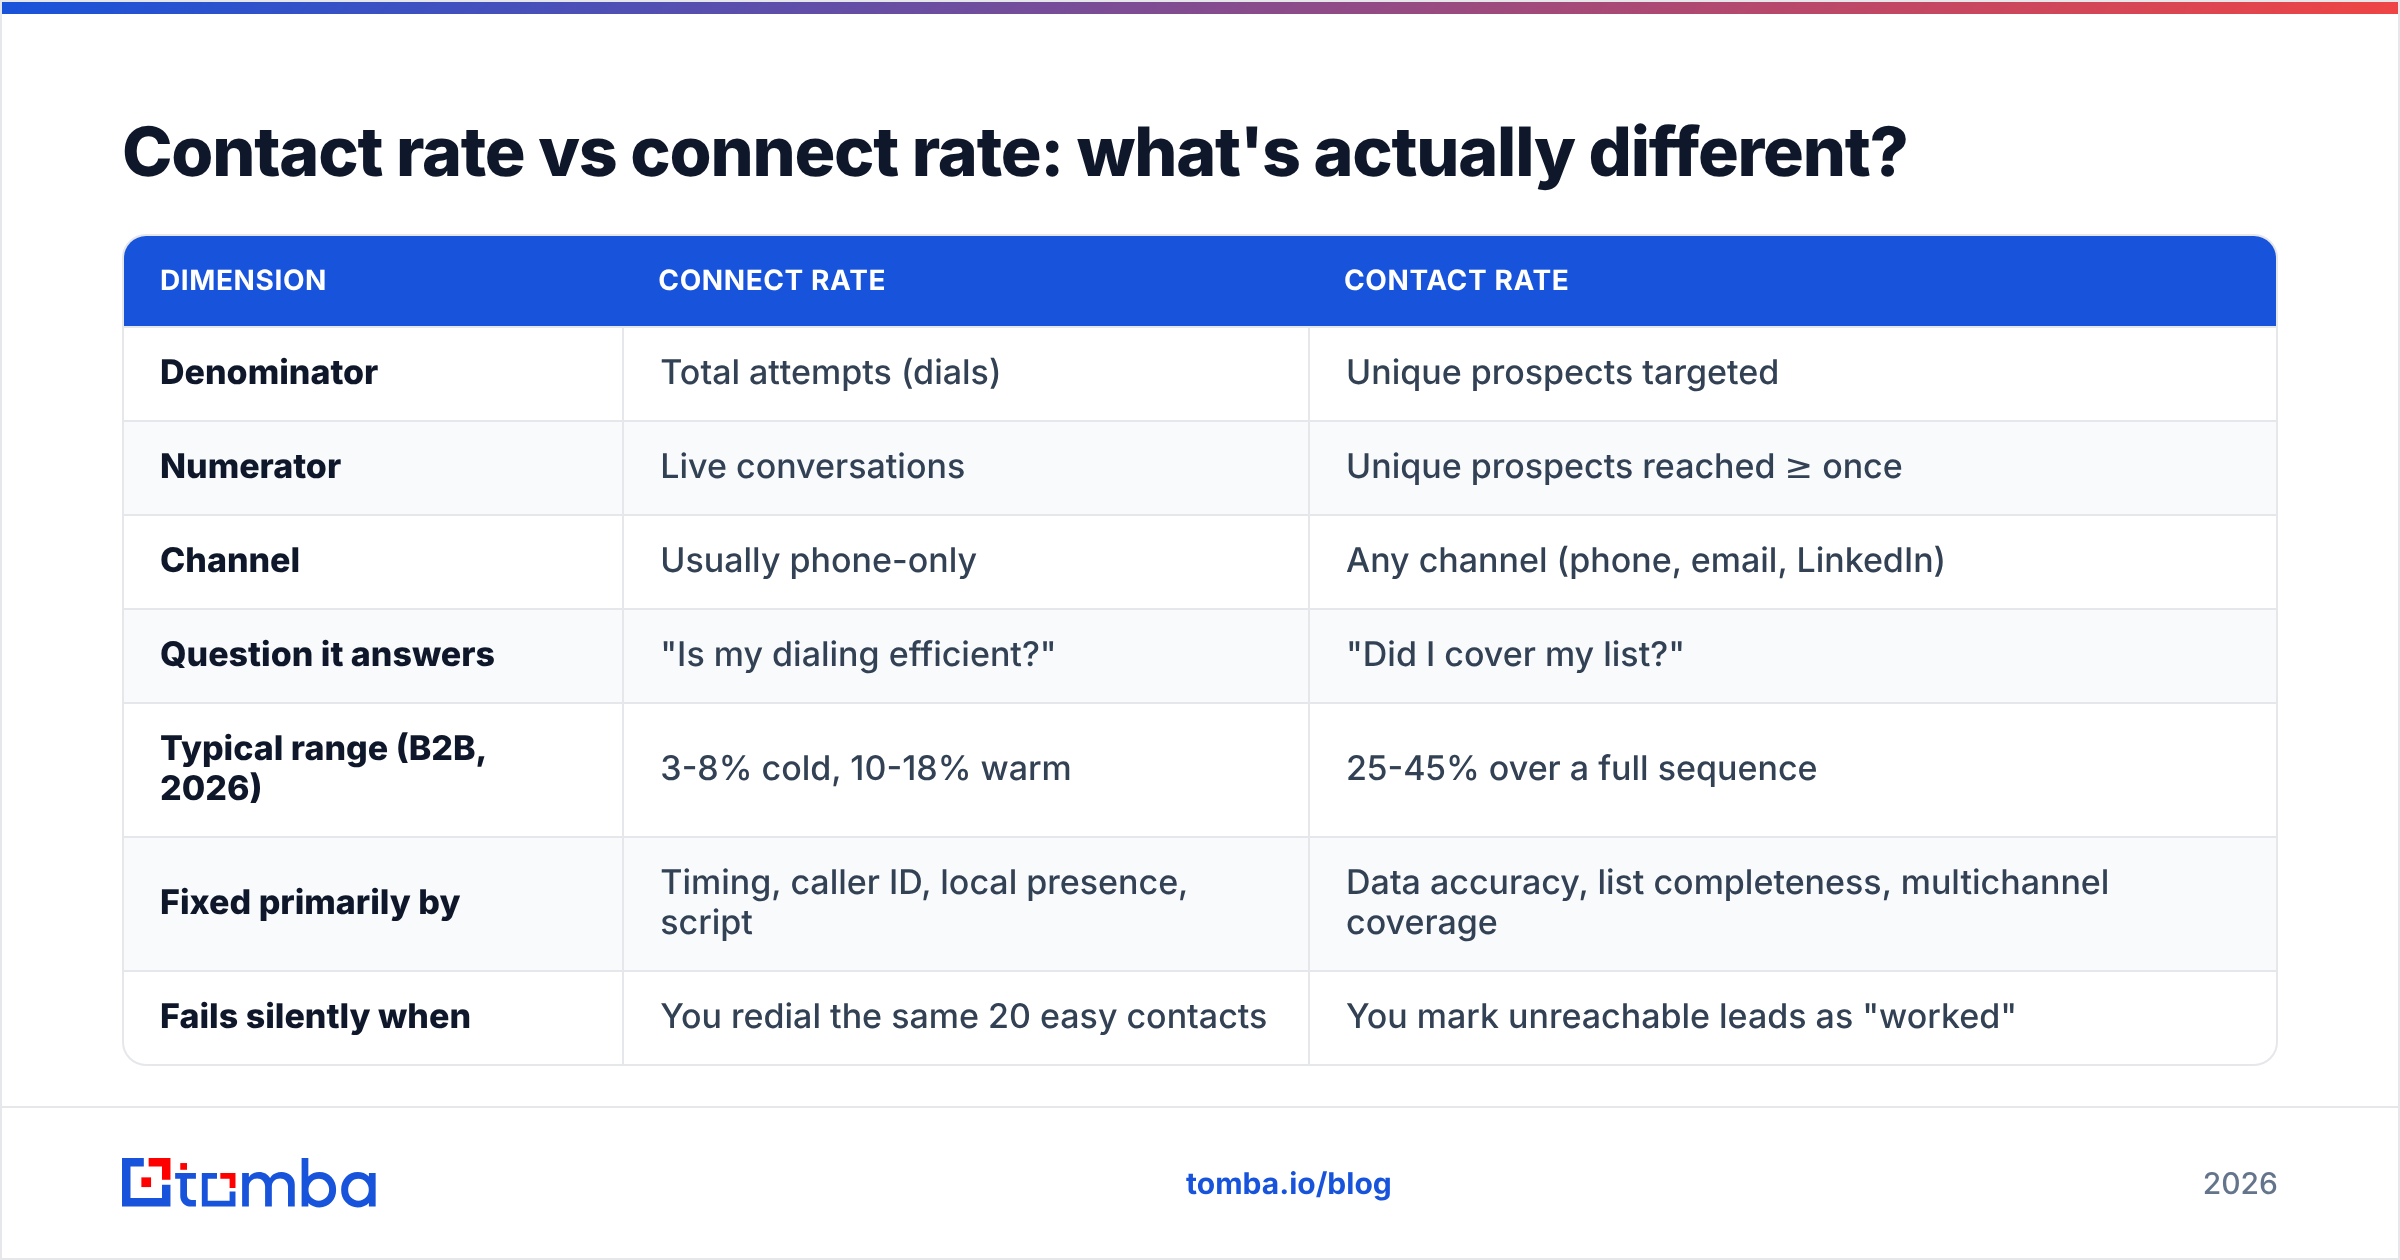
| Dimension | Connect rate | Contact rate |
|---|---|---|
| Denominator | Total attempts (dials) | Unique prospects targeted |
| Numerator | Live conversations | Unique prospects reached ≥ once |
| Channel | Usually phone-only | Any channel (phone, email, LinkedIn) |
| Question it answers | "Is my dialing efficient?" | "Did I cover my list?" |
| Typical range (B2B, 2026) | 3-8% cold, 10-18% warm | 25-45% over a full sequence |
| Fixed primarily by | Timing, caller ID, local presence, script | Data accuracy, list completeness, multichannel coverage |
| Fails silently when | You redial the same 20 easy contacts | You mark unreachable leads as "worked" |
| Who owns it | Reps and sales managers | RevOps and data ops |
The table makes the trap obvious. A rep who wants to game connect rate will hammer the contacts who always pick up. A rep who wants to game contact rate will send one email to everyone and call it coverage. Neither behavior grows pipeline. You need both numbers on the same dashboard so the two incentives cancel each other out.
How do you calculate each one without fooling yourself?#
Most teams get these wrong not because the formula is hard, but because the definitions inside the formula drift. Lock these down in writing before you report a single number.
Define "attempt" precisely. A dial that hits voicemail is an attempt. A dial that rings once and drops because the dialer disconnected is not. If your dialer counts abandoned calls as attempts, your connect rate is artificially deflated by 10-20%.
Define "connect" precisely. Most B2B teams count a connect as any live human answering, including gatekeepers. That's fine — but be consistent. Some teams only count the target decision-maker, which is a different metric (often called "decision-maker connect rate" or DM connect). Reporting one label while measuring the other is how forecasts fall apart.
Define the contact window. Contact rate is meaningless without a time box. "38% contact rate" over a 14-day, 12-touch sequence is strong. The same number over 90 days is mediocre. Always publish the sequence length alongside the metric.
Deduplicate the denominator. If the same person appears three times in your CRM under three job titles, your contact-rate denominator is inflated and your number looks worse than reality. Run a remove duplicates pass before the sequence starts, not after.
Exclude the structurally unreachable — but count them separately. Hard bounces, disconnected numbers, and confirmed job-changers should be removed from the active denominator and reported as a "list decay rate." That decay number is the honest measure of your data vendor.
Attribute by person, not by activity. Contact rate rolls up to a human being. One prospect reached by phone and email is one contact, not two.

What are good connect and contact rate benchmarks in 2026?#
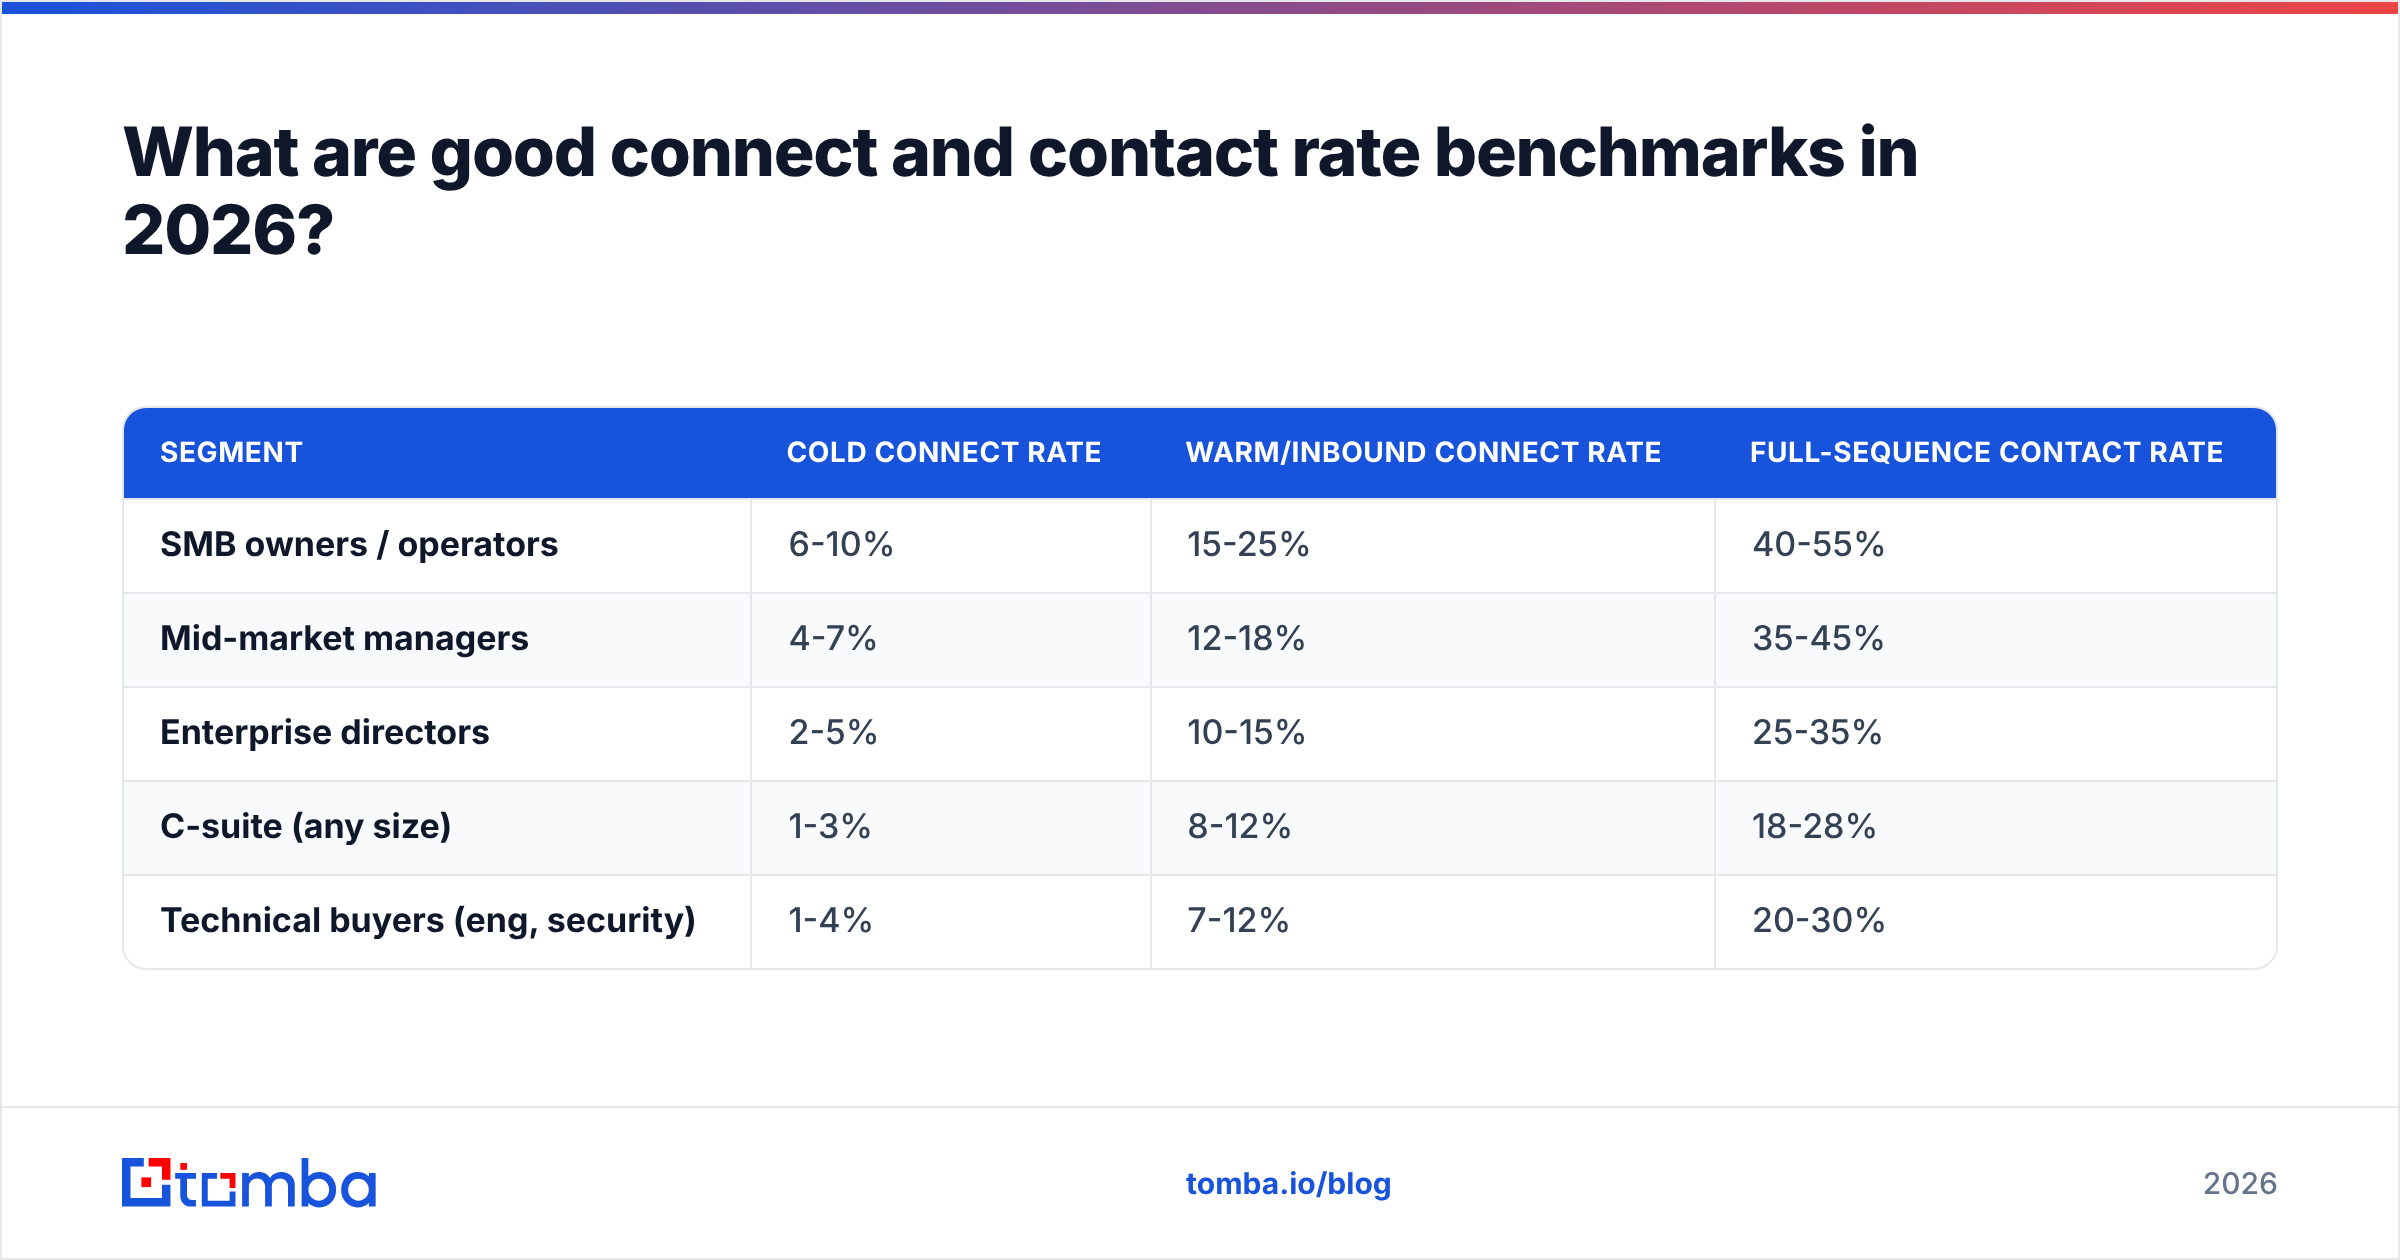
Benchmarks are directional, not gospel — your segment, seniority, and geography move them more than any tactic. But here's the range most B2B outbound teams operate in today, after two years of tightening spam filters and rising mobile call screening.
| Segment | Cold connect rate | Warm/inbound connect rate | Full-sequence contact rate |
|---|---|---|---|
| SMB owners / operators | 6-10% | 15-25% | 40-55% |
| Mid-market managers | 4-7% | 12-18% | 35-45% |
| Enterprise directors | 2-5% | 10-15% | 25-35% |
| C-suite (any size) | 1-3% | 8-12% | 18-28% |
| Technical buyers (eng, security) | 1-4% | 7-12% | 20-30% |
Two patterns worth internalizing.
Connect rate falls as seniority rises, and it falls fast. A CTO has an EA, a screened mobile, and a "no unknown callers" setting. If your team sells to C-level and you're benchmarking against a 8% connect-rate blog post written for SMB sales, you'll conclude your reps are failing when they're actually performing normally. Industry data from HubSpot's sales research has shown this seniority gradient consistently for years.
Contact rate holds up better than connect rate because it's multichannel. You may only connect with 3% of enterprise directors by phone, but you can still contact 30% of them when email replies and LinkedIn responses roll into the same coverage number. That's the entire argument for multichannel sequences — not that email is magic, but that it rescues the coverage metric when the phone channel is structurally hostile.
Why does your connect rate look fine while contact rate quietly craters?#
This is the most common and most expensive failure mode, and it hides in plain sight.
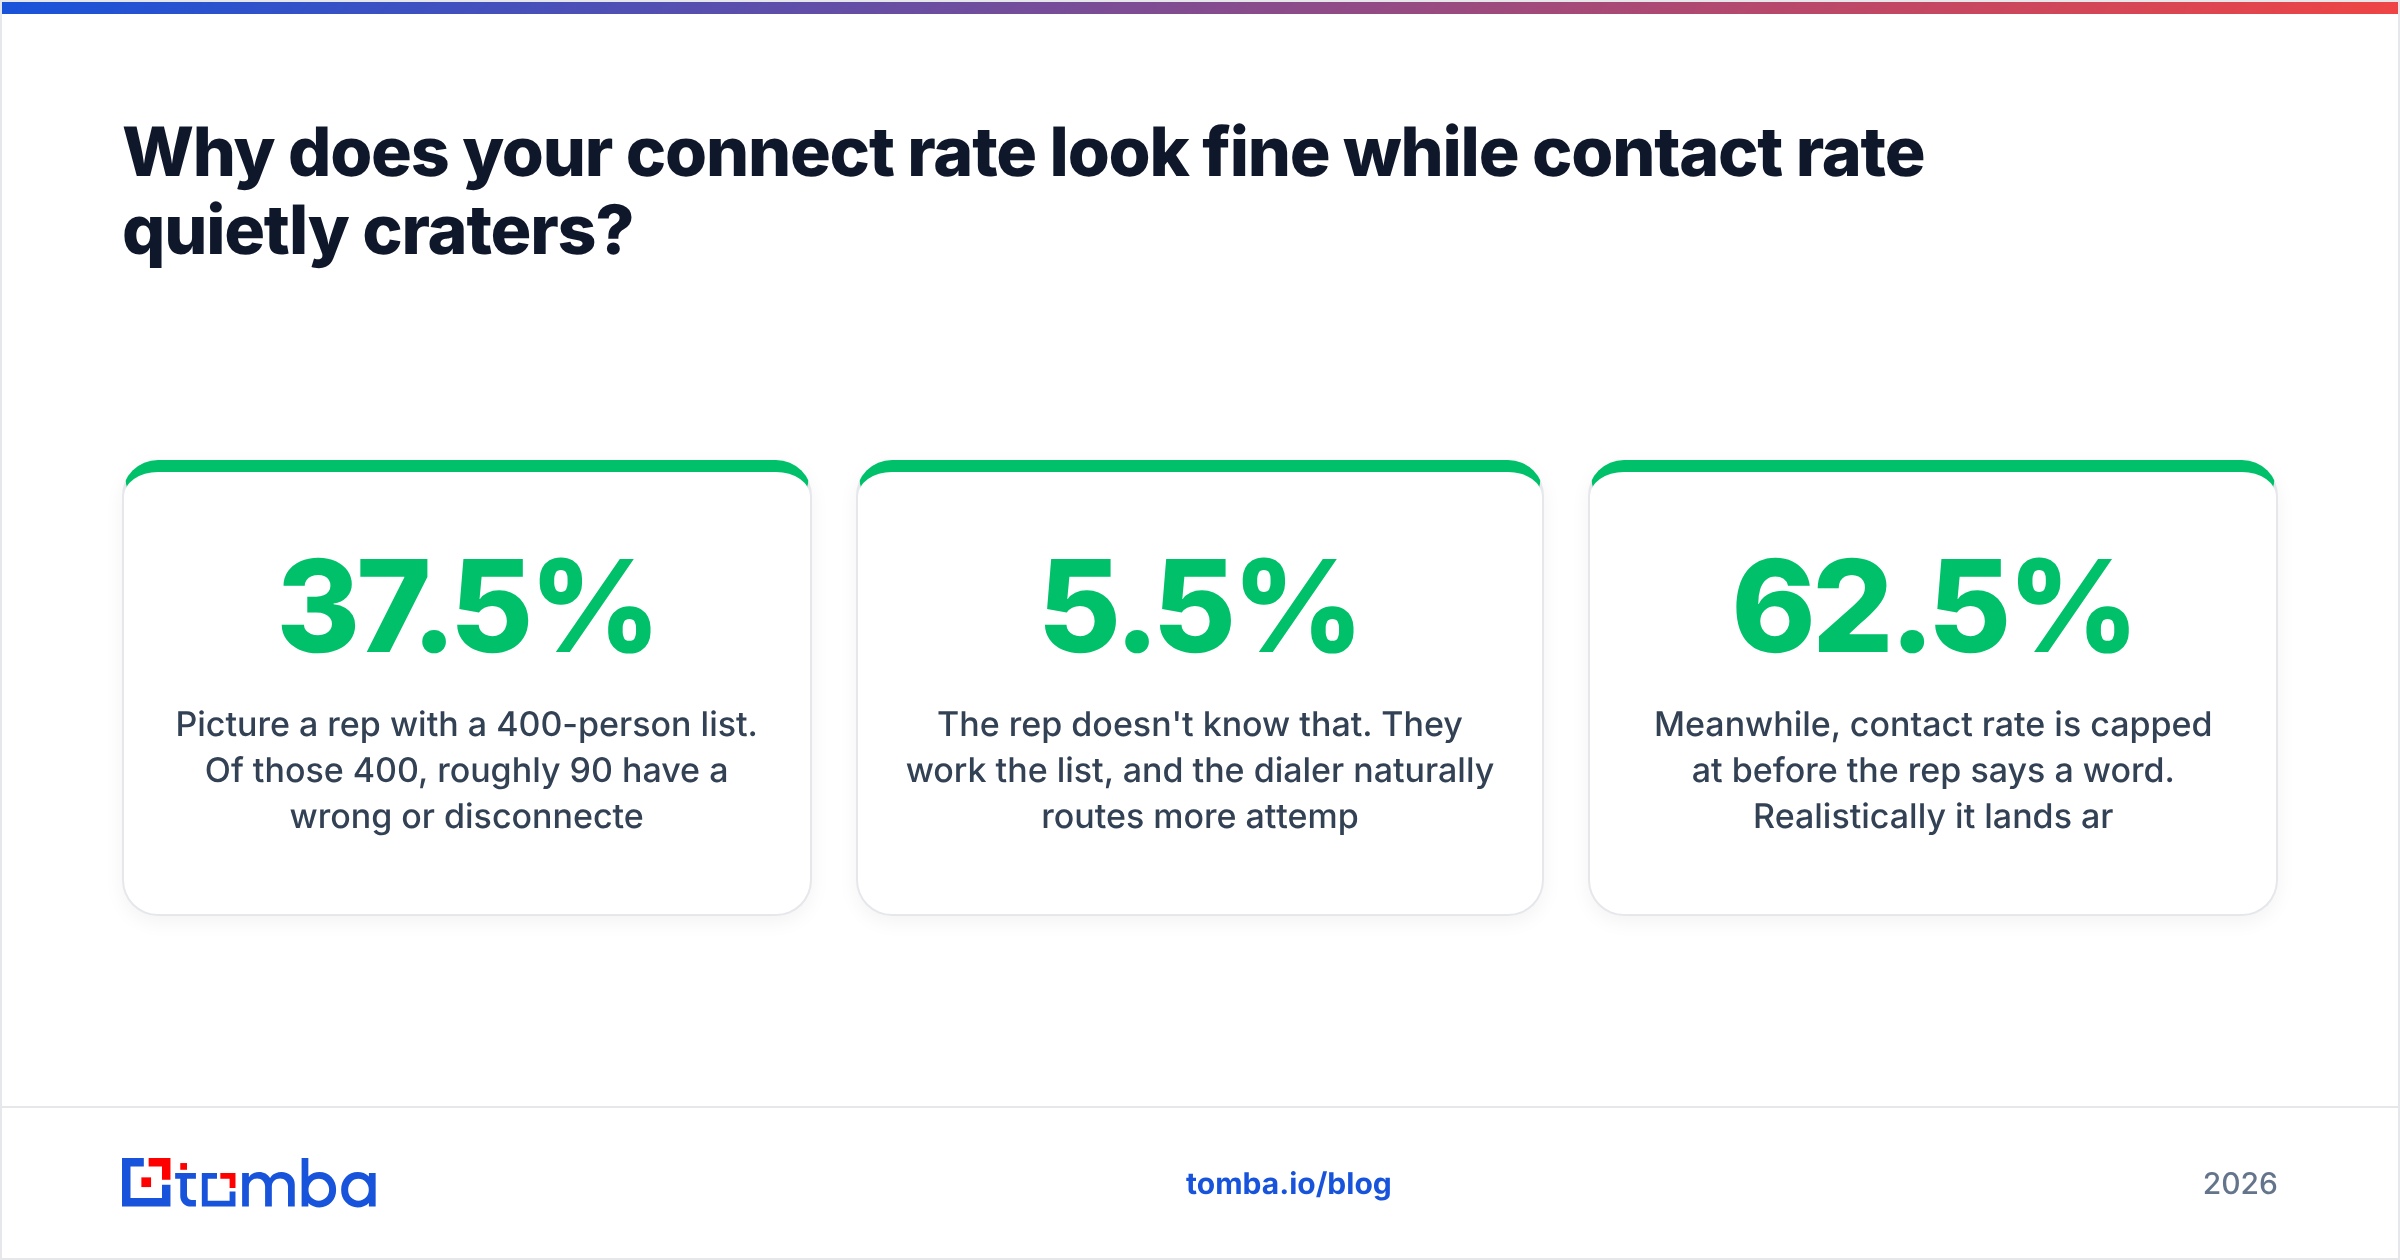
Picture a rep with a 400-person list. Of those 400, roughly 90 have a wrong or disconnected phone number and 60 have an email that will bounce or route to a dead alias. That's 150 people — 37.5% of the list — who cannot be reached, full stop.
The rep doesn't know that. They work the list, and the dialer naturally routes more attempts to the numbers that ring, because bad numbers fail fast and get skipped. So their connect rate — conversations divided by attempts — looks perfectly healthy at 5.5%. The manager sees a green metric and moves on.
Meanwhile, contact rate is capped at 62.5% before the rep says a word. Realistically it lands around 22%. Pipeline comes in light. And because the connect-rate dashboard is green, the team's diagnosis is "reps need better objection handling" — which is precisely the wrong fix. The problem was never the script. It was the list.
The tell is simple: when connect rate is stable but contact rate is declining, you have a data problem, not a performance problem. When both decline together, you have a channel problem (caller ID reputation, spam filtering, timing). Learning to read that two-signal pattern is worth more than any script rewrite.
This is why serious outbound teams put a verification layer in front of the sequence. Running your list through an email verifier before launch and sourcing mobile numbers through a dedicated phone finder doesn't make reps better at calling. It removes the ceiling that was invisibly capping their coverage.
Does data quality move these numbers more than dialing tactics?#
Yes — and it isn't close, at least in the first fix.
Dialing tactics have real but bounded upside. Switching to local presence might lift connect rate from 4.1% to 5.3%. Moving your call block from 2 p.m. to 8 a.m. might add another point. Rewriting the opener might add a half point. Those are worth doing, and they compound. But they're percentage-point improvements on a small base.
Data quality moves the ceiling itself. Cutting a 30% dead-record rate down to 5% doesn't nudge contact rate — it lifts the maximum achievable contact rate by 25 percentage points. Every downstream metric inherits that lift: more contacts, more conversations, more meetings, the same headcount.
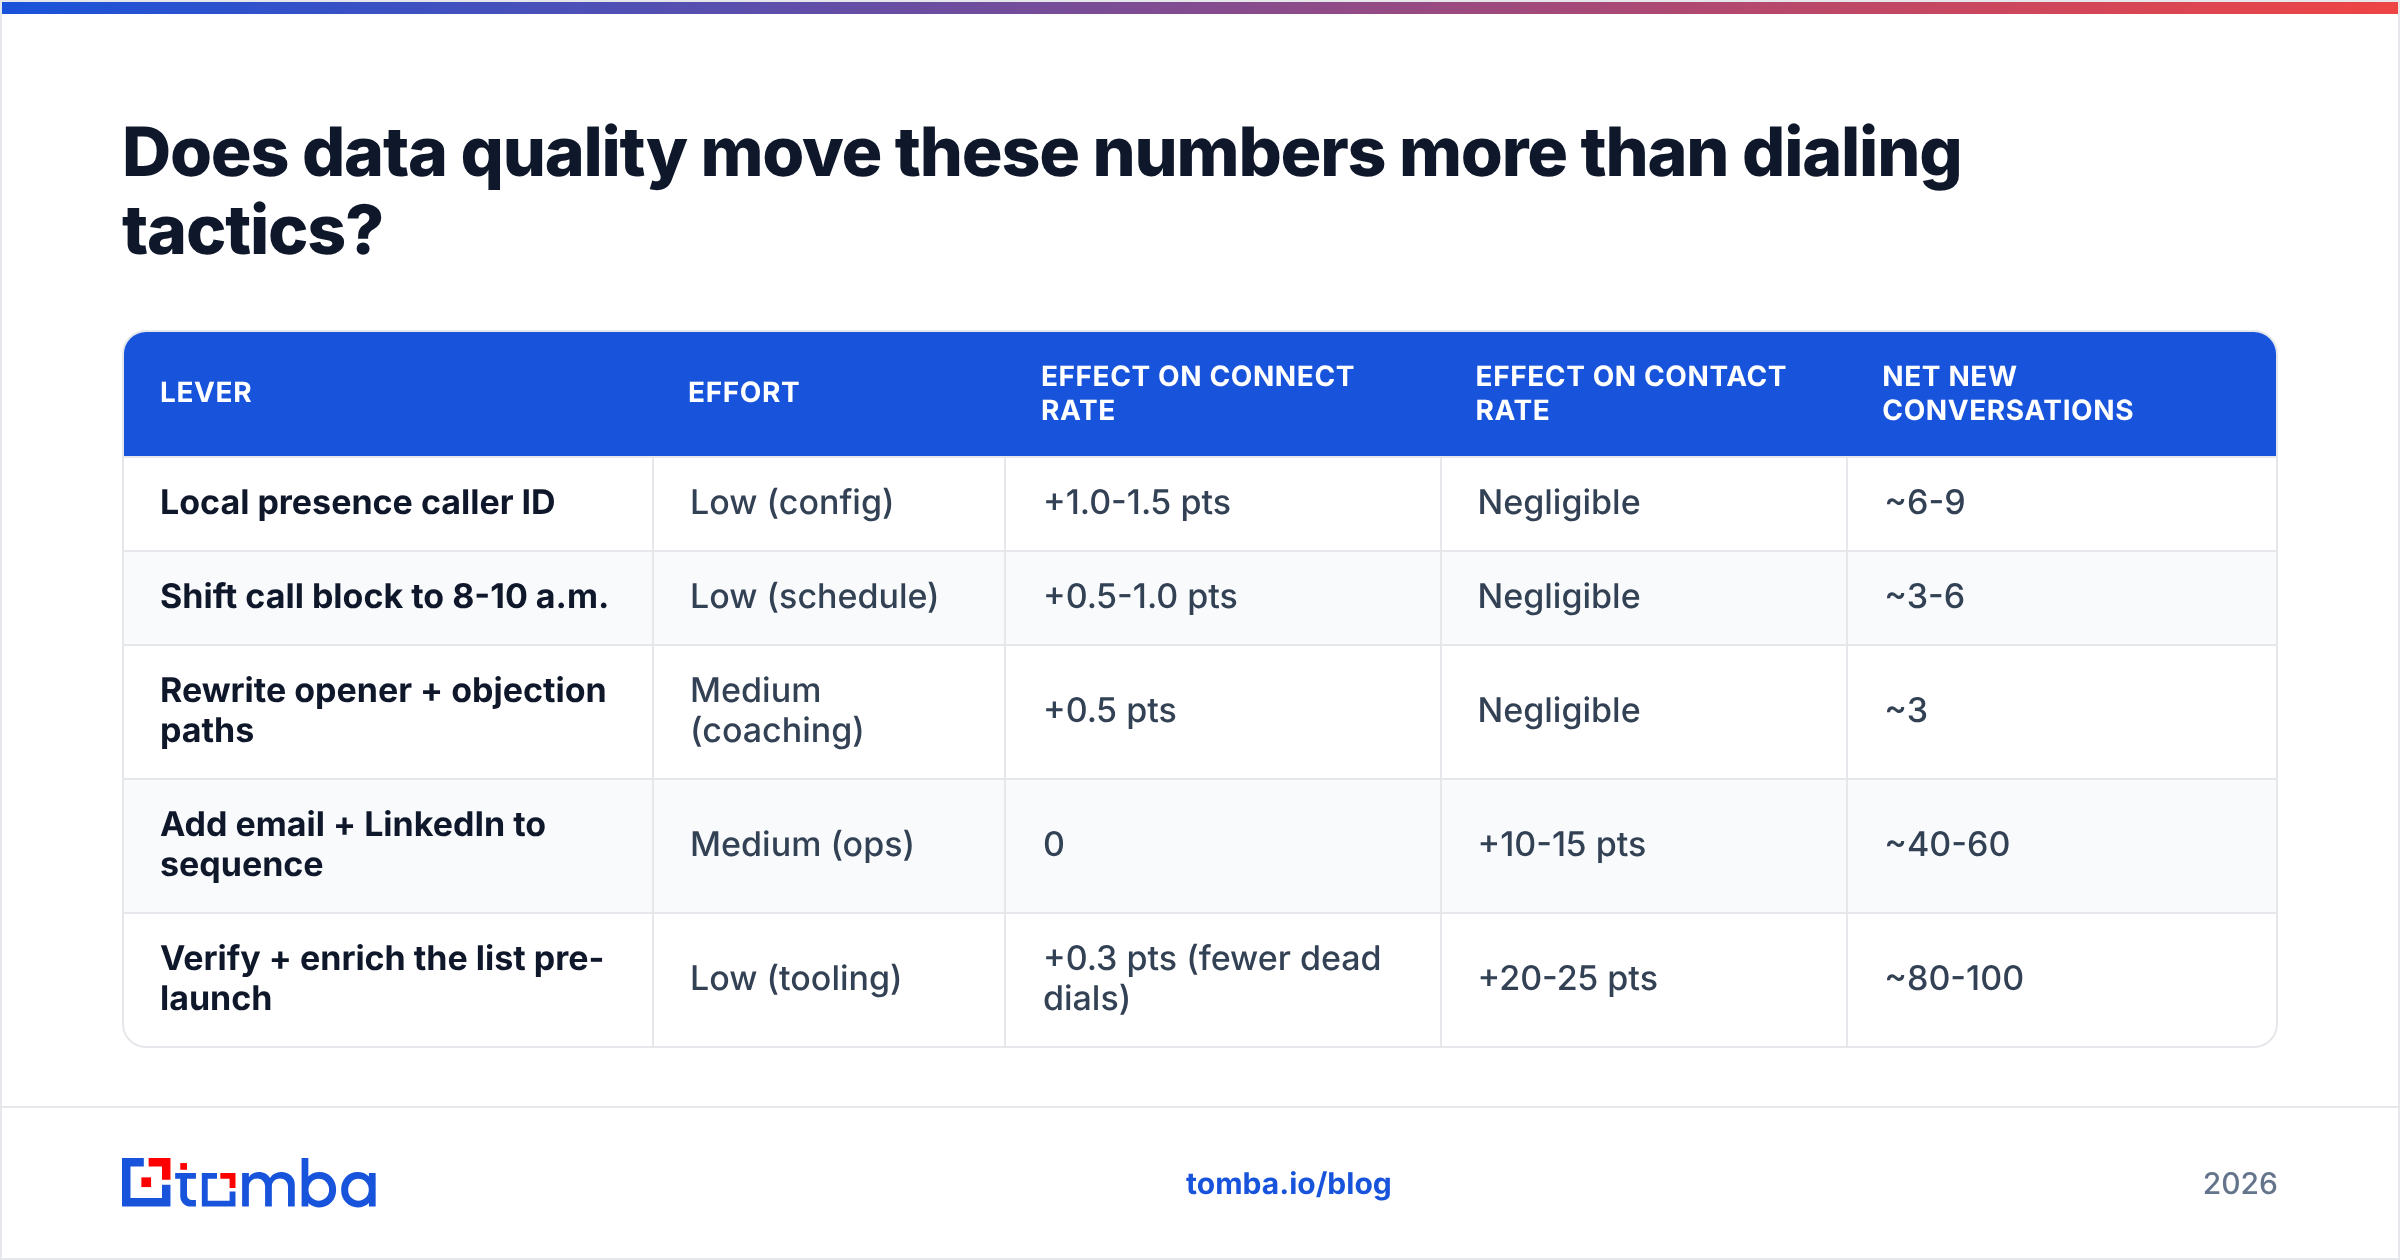
Here's how the two levers compare on a 400-prospect list over one 14-day sequence:
| Lever | Effort | Effect on connect rate | Effect on contact rate | Net new conversations |
|---|---|---|---|---|
| Local presence caller ID | Low (config) | +1.0-1.5 pts | Negligible | ~6-9 |
| Shift call block to 8-10 a.m. | Low (schedule) | +0.5-1.0 pts | Negligible | ~3-6 |
| Rewrite opener + objection paths | Medium (coaching) | +0.5 pts | Negligible | ~3 |
| Add email + LinkedIn to sequence | Medium (ops) | 0 | +10-15 pts | ~40-60 |
| Verify + enrich the list pre-launch | Low (tooling) | +0.3 pts (fewer dead dials) | +20-25 pts | ~80-100 |
Note the asymmetry. The tactical levers each buy you a handful of conversations. The data levers buy you an order of magnitude more — because they're not making the funnel more efficient, they're making it bigger.
None of this means tactics are pointless. It means sequencing matters: fix the data, then tune the dialing. Doing it in the reverse order means you spend a quarter coaching reps on a list that was never going to work.

Which metric should you actually optimize?#
Optimize contact rate as the primary target and treat connect rate as a diagnostic.
The logic: contact rate is closer to the business outcome. Pipeline is generated by people you reached, not by attempts that connected. A team can improve connect rate by 40% relative and generate zero additional pipeline if all those extra connects came from redialing the same 30 receptive contacts.
But you can't just ignore connect rate, because it's your early-warning system. Connect rate reacts within hours; contact rate takes a full sequence to resolve. If your caller ID gets flagged on a Monday, connect rate tells you Monday afternoon. Contact rate won't tell you until the sequence ends two weeks later, by which point you've burned an entire cohort.
Practical setup for most teams:
- Weekly leadership review: contact rate by segment, plus list decay rate. These drive strategy and data-vendor decisions.
- Daily rep dashboard: connect rate, attempts per contact, and conversation length. These drive coaching and same-day fixes.
- Guardrail metric: attempts-per-unique-contact. If this climbs above 8-10 across a sequence, reps are grinding a shrinking pool — which usually means the list is thinner than the CRM claims.
- Downstream check: response rate and meetings booked per 100 contacts. If contact rate rises but meetings don't, your targeting is off, not your data.
Sales-engagement platforms reviewed on G2 increasingly report both metrics natively, but almost all of them default to attempt-based denominators. Check what your tool is actually dividing by before you trust the label on the chart. And if you're standardizing definitions across a growing team, Salesforce's sales metrics guidance is a reasonable starting template to adapt.
What are the most common mistakes teams make with these two metrics?#
- Reporting connect rate as if it were contact rate in board decks. The connect number is always smaller and always sounds worse. Executives who see 4% and think it means "we only reached 4% of our market" make bad budget decisions.
- Leaving unreachable records in the denominator. This makes contact rate look terrible and reps look lazy, when the actual issue is a stale data source.
- Removing unreachable records without tracking them. The opposite error: you get a clean-looking 44% contact rate that hides a 30% list decay rate you're paying a vendor for.
- Counting a voicemail as a contact. It isn't. It's an attempt. If you count voicemails, contact rate becomes a vanity metric that tracks effort, not reach.
- Comparing quarters without normalizing sequence length. A 12-touch Q1 sequence and an 8-touch Q2 sequence produce contact rates that cannot be compared.
- Never re-verifying. B2B contact data decays roughly 2-3% per month through job changes alone. A list verified in January is meaningfully worse by June. Building data enrichment into a recurring cadence — not a one-time cleanup — is what keeps contact rate from drifting down every quarter.
Where do you go from here?#
Start by pulling both numbers for last quarter, honestly, with the definitions from this post. Most teams discover their real contact rate is 10-15 points below what they assumed, and that the gap is almost entirely dead records rather than rep effort.
Then fix the input before you touch the process. Build your target list from verified, current data — accurate work emails, real mobile numbers, and role information that reflects who's actually in the seat today. Tomba's Email Finder is built for exactly that: find and confirm the professional email addresses behind your target accounts before the sequence starts, so the coverage ceiling you're working against is one you set, not one your data vendor set for you. The free tier gives you 25 searches a month to test the accuracy against your own list; paid plans start at $49/mo when you're ready to run it at volume — full details on the Tomba pricing page.
Connect rate tells you how well you're calling. Contact rate tells you whether the calling ever had a chance. Fix the second one first.
Related guides#
Ready to find emails that actually work?
Join 150,000+ professionals who stopped guessing and started sending. Free credits on signup — no credit card required.
Get the Tomba newsletter
Practical outbound tactics and product updates — once every two weeks.
About the author