Email Analytics in 2026: Metrics That Actually Predict Revenue
Open rates stopped meaning anything the day Apple started prefetching pixels. Here's the email analytics stack that still tells you the truth about pipeline.
TL;DR
- Open rate is no longer a measurement — it's noise. Apple Mail Privacy Protection, Gmail image proxying, and security scanners inflate it by 20-60% depending on your list.
- The four metrics that still correlate with revenue: reply rate, qualified reply rate, bounce rate, and inbox placement. Everything else is diagnostic at best.
- Your analytics are only as clean as your list. A 12% bounce rate makes every downstream percentage meaningless because the denominator is fiction.
- Sending platforms (Instantly, Smartlead, Woodpecker) measure sequence performance. CRMs (HubSpot, Salesforce) measure revenue attribution. Deliverability tools (Postmaster, GlockApps) measure whether you were even seen. You need all three layers — one tool does not cover it.
- Build the report in this order: deliverability → engagement → conversion → cohort. Reversing that order is how teams end up optimizing subject lines for a domain that's already in spam.
What Is Email Analytics, Really?#
Email analytics is the practice of measuring what happens to a message after you press send — delivery, placement, engagement, reply quality, and eventual revenue — and using that data to change the next send.
That definition sounds obvious. In practice, most teams do something narrower: they read the dashboard their sending tool happens to show them and call it analytics. Those two things diverge badly. A sequence dashboard tells you what percentage of contacts triggered a tracking pixel. It does not tell you whether the message landed in Promotions, whether the reply was a human or an autoresponder, or whether the 3 meetings booked came from your best-performing subject line or from the one lucky referral in the list.
Think of it like a restaurant. Your sending tool counts plates that left the kitchen. Email analytics is the whole loop: did the food reach the table, did anyone eat it, did they come back, and did the check clear. Counting plates feels like measurement, which is exactly what makes it dangerous.
Why Did Open Rates Stop Working?#
Because open tracking was never measuring opens — it was measuring image loads, and in 2026 something other than a human loads most of those images.
Three things broke it:
- Apple Mail Privacy Protection. Since iOS 15, Apple Mail prefetches remote content through a proxy for users who enable protection. Every one of those contacts registers as an open whether they read the message or deleted it unread. Apple Mail accounts for a large share of B2B mobile reads, so this alone can inflate reported opens by tens of percentage points.
- Gmail image proxying and scanners. Google caches images server-side. Corporate security gateways — Proofpoint, Mimecast, Barracuda — click links and load assets to sandbox them before delivery. Those are machine opens and machine clicks.
- Bot clicks on link tracking. If your reported click rate is suspiciously close to your open rate, or you see clicks arriving within one second of delivery, you are looking at a scanner, not a prospect.
The practical consequence: you cannot A/B test subject lines on open rate anymore. You can only test them on downstream reply rate, which needs far more volume to reach significance. Teams that skip this step spend quarters "improving" a metric that a proxy server controls.

Open rate still has one legitimate use: as a relative directional signal within a single segment over time. If opens across your entire Gmail segment fall from 45% to 12% in a week, that's not a copy problem — that's a deliverability event, and it's worth an alert. Use it as a smoke detector, not a scoreboard.
Which Email Metrics Still Predict Revenue?#
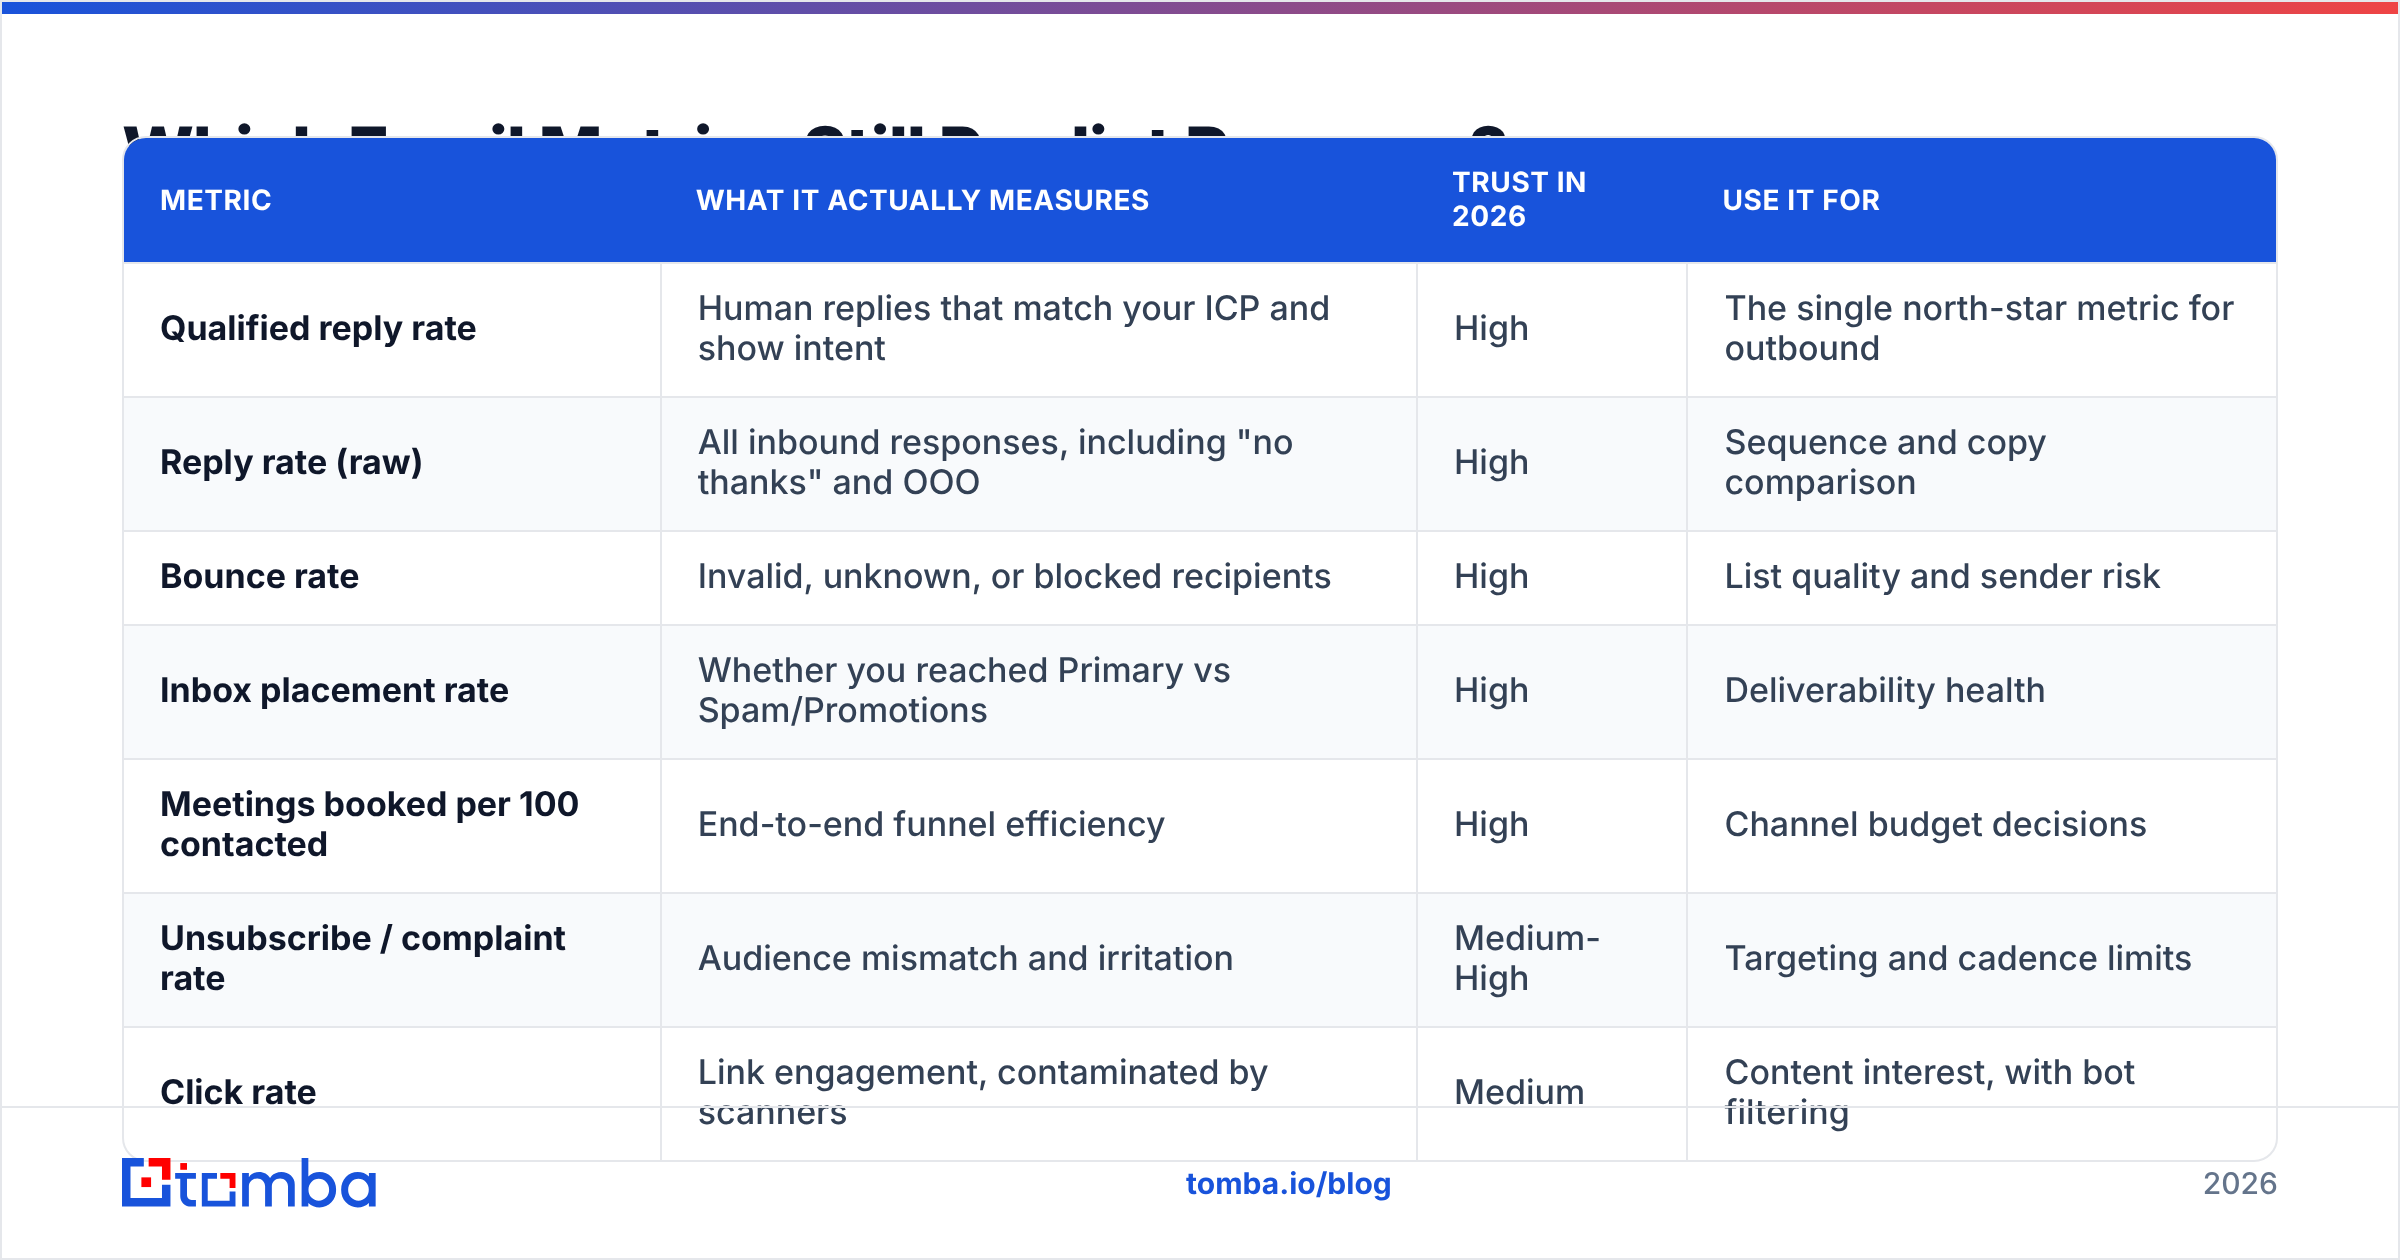
Here's the honest hierarchy. Trust column reflects how resistant each metric is to proxy inflation, bot activity, and denominator problems.
| Metric | What it actually measures | Trust in 2026 | Use it for |
|---|---|---|---|
| Qualified reply rate | Human replies that match your ICP and show intent | High | The single north-star metric for outbound |
| Reply rate (raw) | All inbound responses, including "no thanks" and OOO | High | Sequence and copy comparison |
| Bounce rate | Invalid, unknown, or blocked recipients | High | List quality and sender risk |
| Inbox placement rate | Whether you reached Primary vs Spam/Promotions | High | Deliverability health |
| Meetings booked per 100 contacted | End-to-end funnel efficiency | High | Channel budget decisions |
| Unsubscribe / complaint rate | Audience mismatch and irritation | Medium-High | Targeting and cadence limits |
| Click rate | Link engagement, contaminated by scanners | Medium | Content interest, with bot filtering |
| Open rate | Image loads, mostly non-human | Low | Deliverability smoke alarm only |
A few notes on reading that table:
- Qualified reply rate beats raw reply rate every time. A 9% reply rate where two-thirds are "wrong person" is worse than a 4% rate that's all decision-makers. Tag replies into four buckets — interested, not now, wrong person, hard no — and report the first two as qualified. This is the number that survives a board meeting.
- Complaint rate is a hard ceiling, not a KPI. Google and Yahoo bulk-sender requirements put the practical threshold around 0.3%, and above that your domain reputation degrades regardless of how good your copy is. Watch it in Google Postmaster Tools, not in your sending platform.
- Bounce rate is a denominator problem, not just a hygiene problem. If 12% of your list is invalid, then "reply rate" is calculated against 12% phantom contacts and every percentage you report is understated. Fix the list before you interpret anything. Running the list through an email verifier before import is the cheapest analytics improvement available — it corrects the denominator for every metric downstream.
- Meetings per 100 contacted is the only metric non-email people care about. Report it. It also forces you to instrument the CRM handoff, which is where most attribution breaks.
How Do You Build an Email Analytics Stack?#
In four layers, in this order. Skipping a layer means you'll misattribute the layer above it.
Layer 1 — Deliverability and placement. Before engagement means anything, confirm the message arrives. You need SPF, DKIM, and DMARC verified; domain reputation monitored; and seed-list placement tested per mailbox provider. Tools: Google Postmaster Tools (free, Gmail only), Microsoft SNDS, GlockApps or MailReach for seed testing. Cross-check your SPF record and your sender reputation any time reply rates drop without a copy change.
Layer 2 — Engagement. Replies, clicks, unsubscribes, per-sequence and per-step. This lives in your sending platform. The critical configuration choice: turn off open tracking pixels on cold sends, or at minimum exclude them from your reporting. Pixels add a remote image to a plain-text-looking email, which is itself a mild spam signal, and the data they return is unusable.
Layer 3 — Conversion and attribution. Replies → meetings → opportunities → closed revenue. This is CRM work. The mistake is stamping the CRM record with "source: outbound" and nothing else. Stamp the sequence ID, the step number, the sending mailbox, and the segment. Without those four fields you can measure that outbound works but never which outbound works.
Layer 4 — Cohort analysis. Group by segment, ICP tier, seniority, company size, and send week. Then compare. This is where the real findings live: the 40-person SaaS segment replies at 3x the enterprise segment, or step 3 of your sequence outperforms step 1 and should be step 1. Weekly cohorts also expose deliverability decay that daily numbers hide in the noise.

Which Email Analytics Tools Should You Use?#
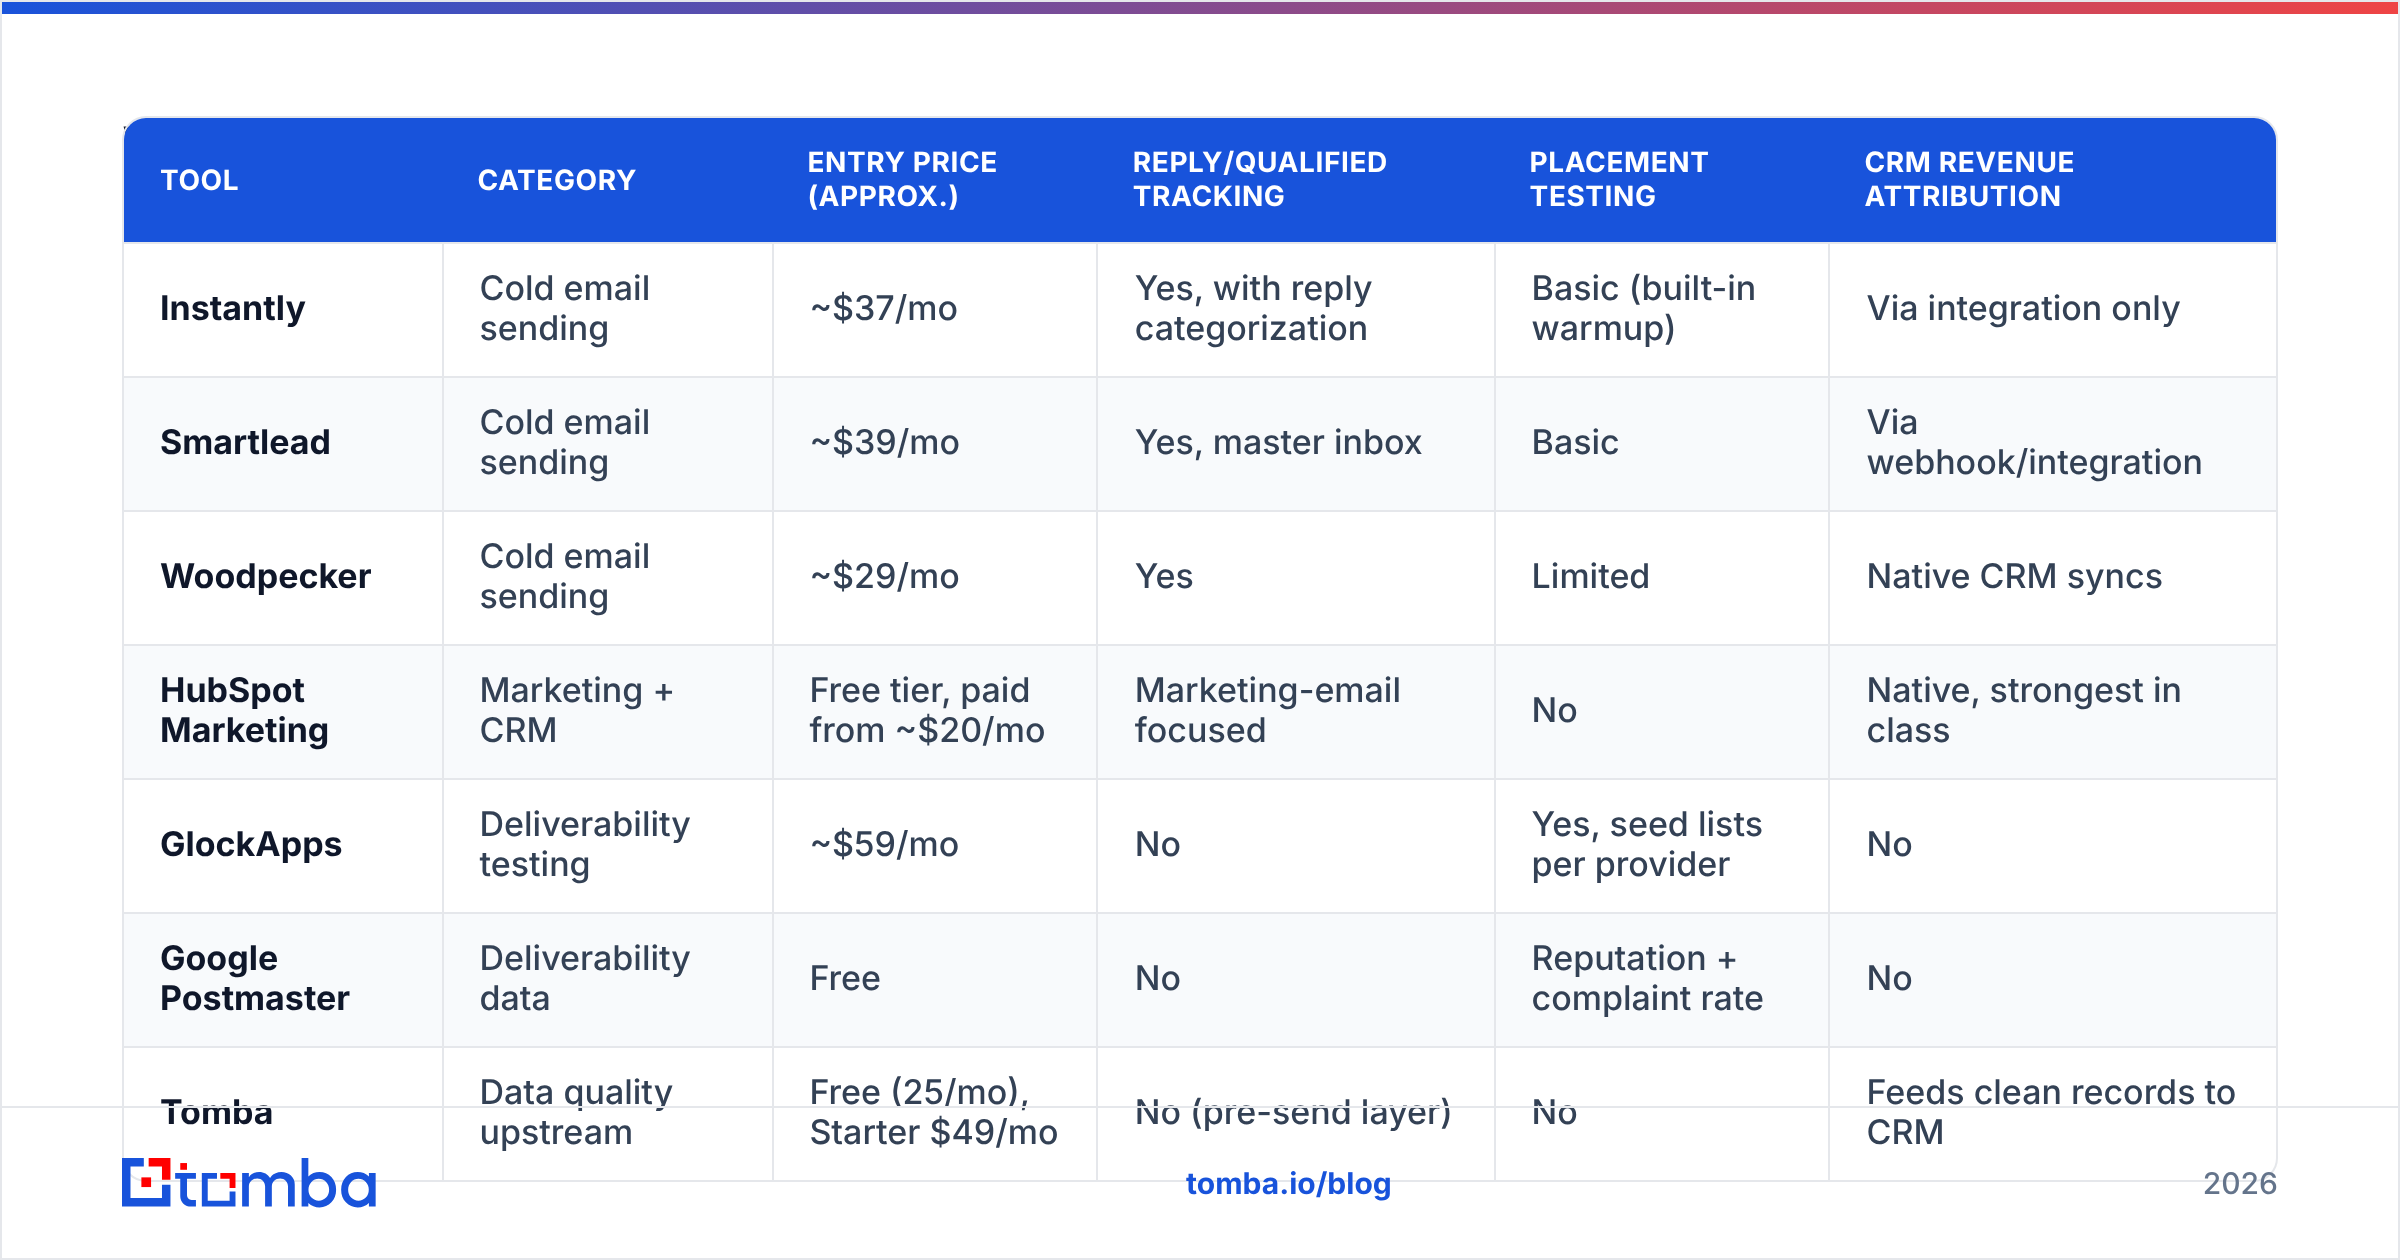
There is no single tool. There are three categories, and the comparison below reflects what each is genuinely good at rather than what its homepage claims. Pricing is the entry tier at time of writing — verify current numbers before you budget.
| Tool | Category | Entry price (approx.) | Reply/qualified tracking | Placement testing | CRM revenue attribution |
|---|---|---|---|---|---|
| Instantly | Cold email sending | ~$37/mo | Yes, with reply categorization | Basic (built-in warmup) | Via integration only |
| Smartlead | Cold email sending | ~$39/mo | Yes, master inbox | Basic | Via webhook/integration |
| Woodpecker | Cold email sending | ~$29/mo | Yes | Limited | Native CRM syncs |
| HubSpot Marketing | Marketing + CRM | Free tier, paid from ~$20/mo | Marketing-email focused | No | Native, strongest in class |
| GlockApps | Deliverability testing | ~$59/mo | No | Yes, seed lists per provider | No |
| Google Postmaster | Deliverability data | Free | No | Reputation + complaint rate | No |
| Tomba | Data quality upstream | Free (25/mo), Starter $49/mo | No (pre-send layer) | No | Feeds clean records to CRM |
The pattern to notice: nothing in that table does all three jobs. Sending platforms under-report deliverability because it's not flattering to them. Deliverability tools have no idea whether a reply was qualified. CRMs are blind to placement entirely. Reviews on G2 will tell you a tool is "all-in-one"; the layer model above tells you what it actually covers.
Tomba sits before all three. It isn't an analytics dashboard — it's the input quality layer. If your list comes in with verified addresses and correct company data, your bounce rate is low, your denominators are honest, and your reputation stays intact. If it doesn't, you're doing statistics on garbage. Use bulk verify on every import and treat the pass rate as your first analytics number of the week.
What Are Good Email Analytics Benchmarks in 2026?#
Benchmarks are useful for sanity-checking, dangerous for goal-setting. Your ICP, offer, and list source move these numbers more than any tactic. Published marketing-email averages from vendors like Mailchimp and HubSpot run higher than cold outbound because they measure opted-in audiences — do not compare your cold numbers to them.
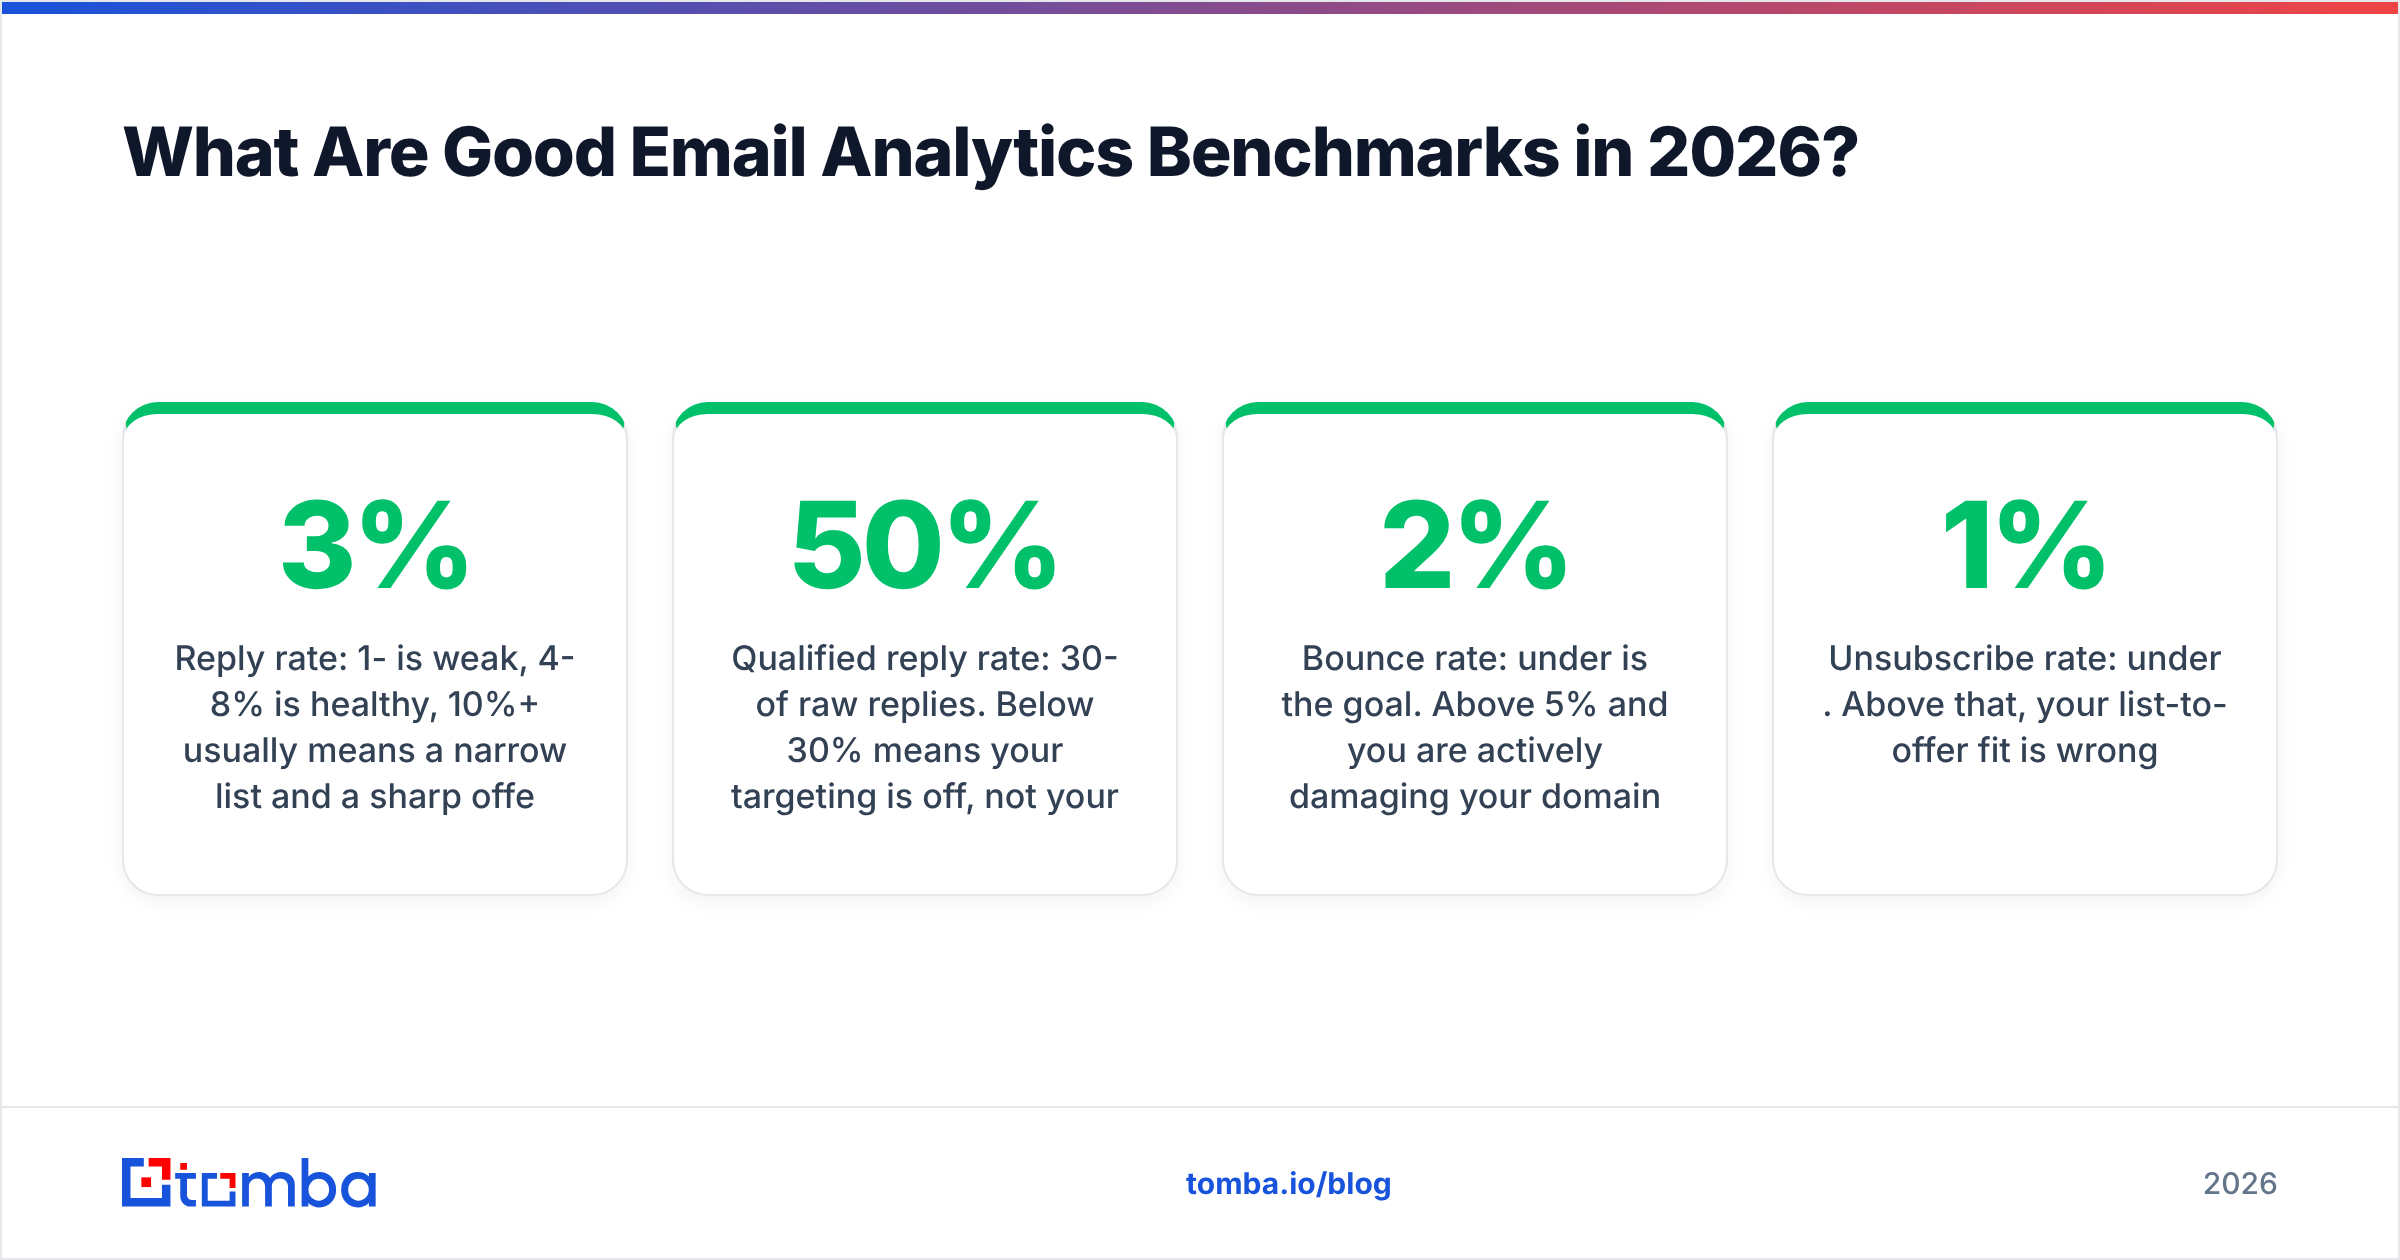
Rough working ranges for B2B cold outbound:
- Reply rate: 1-3% is weak, 4-8% is healthy, 10%+ usually means a narrow list and a sharp offer (or a very small sample).
- Qualified reply rate: 30-50% of raw replies. Below 30% means your targeting is off, not your copy.
- Bounce rate: under 2% is the goal. Above 5% and you are actively damaging your domain.
- Unsubscribe rate: under 1%. Above that, your list-to-offer fit is wrong.
- Spam complaint rate: under 0.1%. Treat 0.3% as a fire alarm.
- Meetings per 100 contacted: 1-3 for most mid-market motions. This is the number to forecast off.
If your reply rate looks great but qualified replies are near zero, you have an offer that attracts curiosity from the wrong people. If both look fine but no meetings appear, the break is in the handoff, not the email. Understanding what moves response rate at the segment level is more valuable than chasing a benchmark you can't contextualize.
How Do You Report Email Analytics Without Lying?#
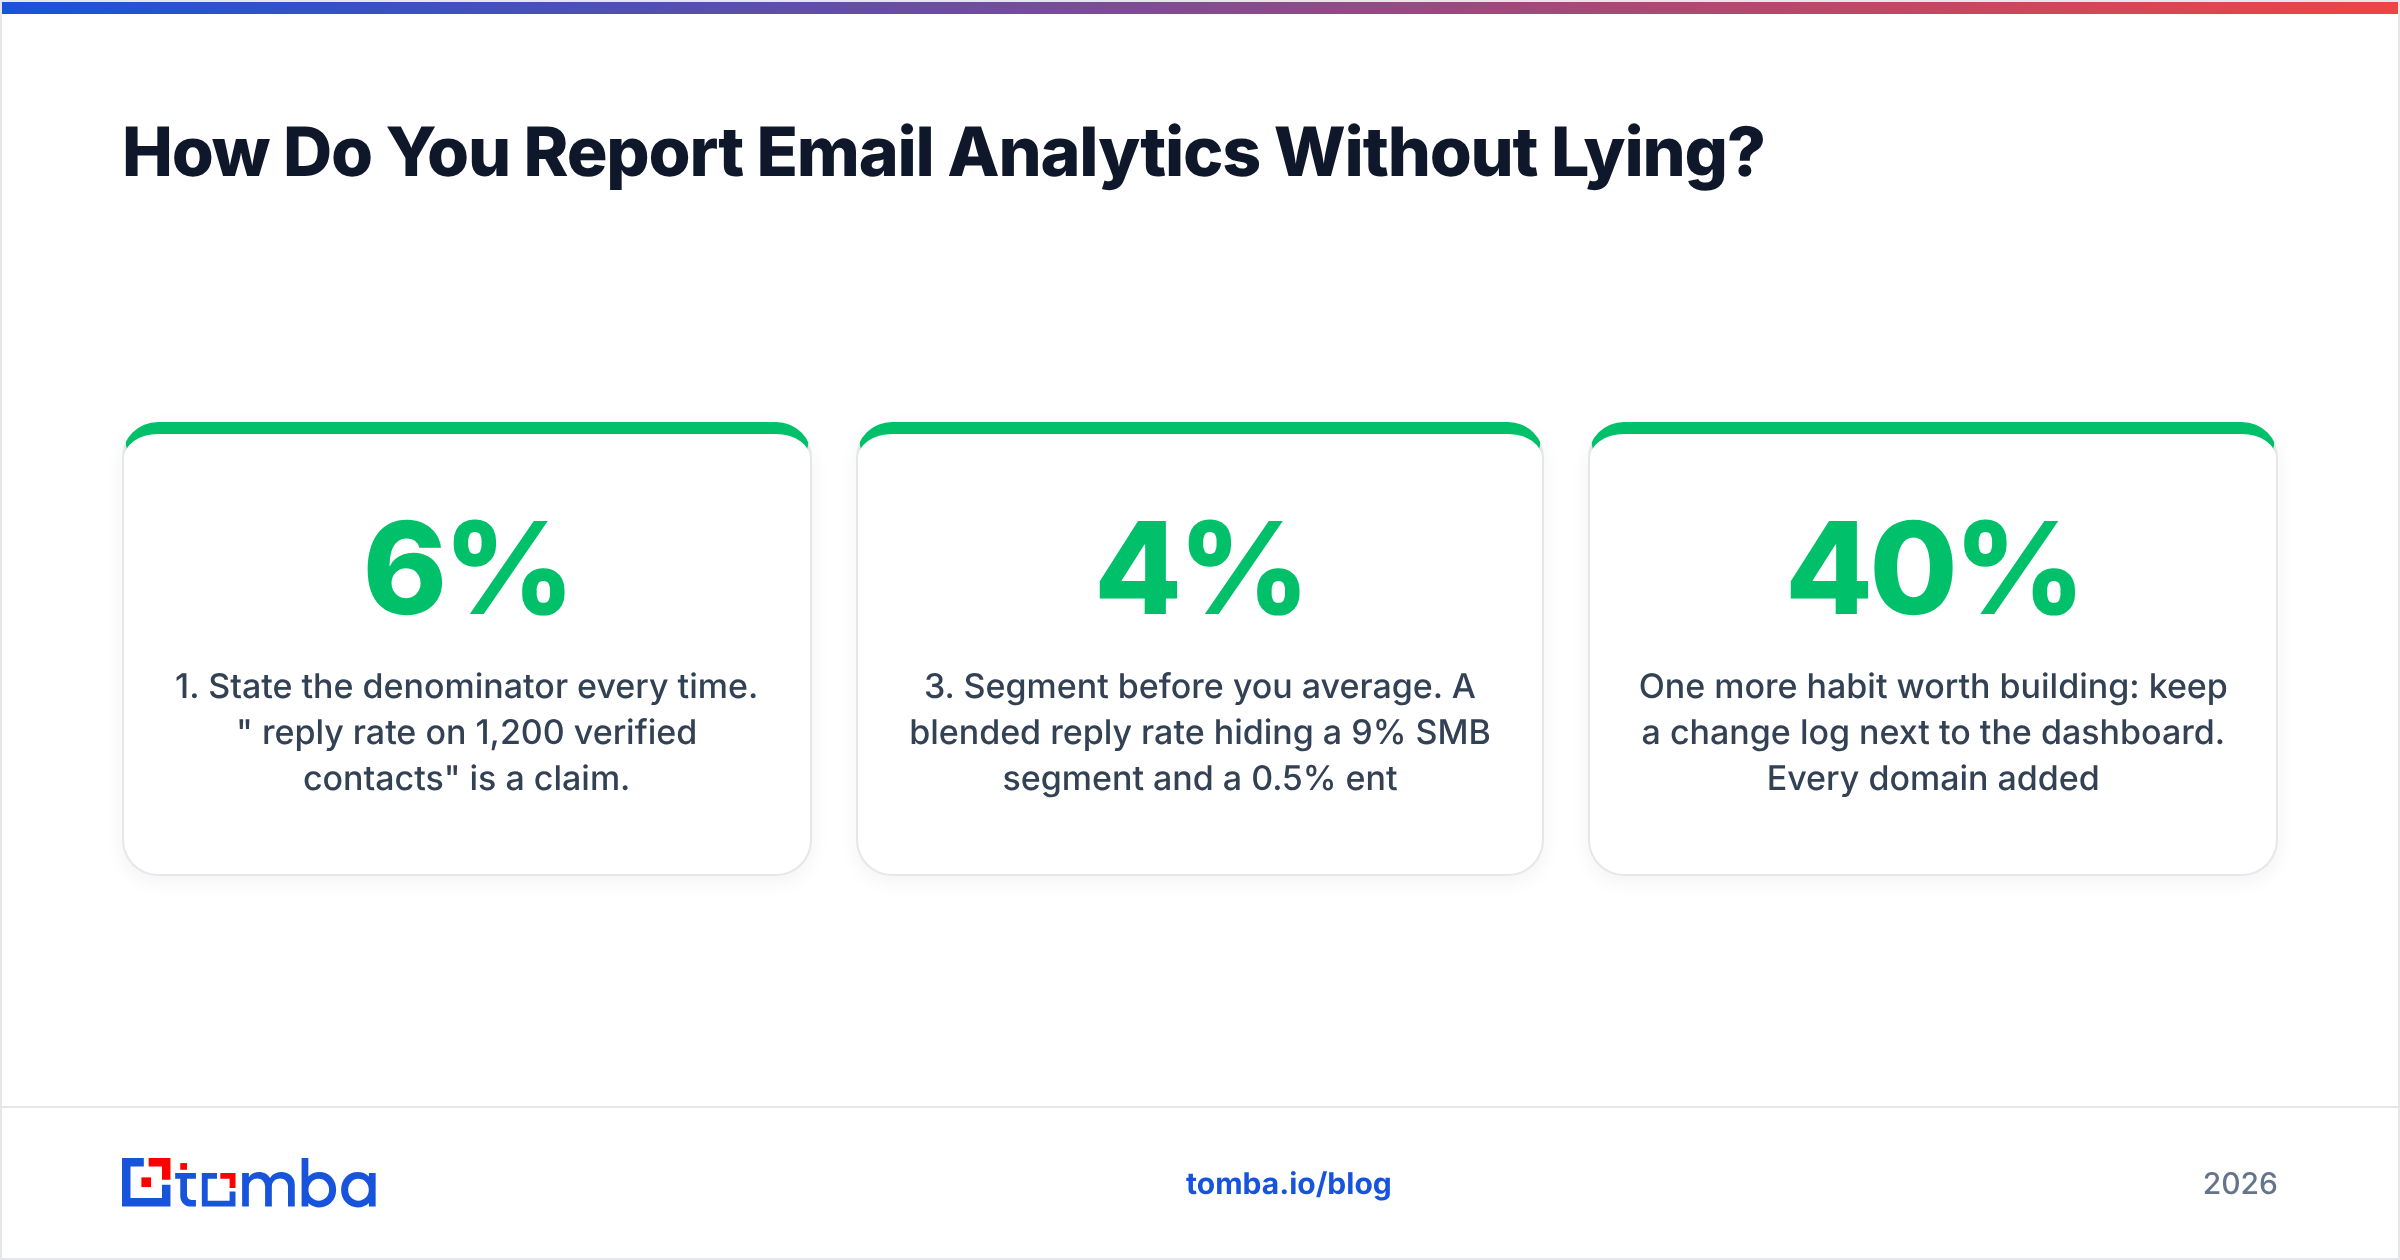
Adopt four rules and most reporting disputes disappear.
- State the denominator every time. "6% reply rate on 1,200 verified contacts" is a claim. "6% reply rate" is a vibe. Always report contacts delivered, not contacts uploaded.
- Never report open rate without a footnote. If leadership expects it, keep it, but label it "inflated by privacy proxies — directional only." One sentence prevents a quarter of bad decisions.
- Segment before you average. A blended 4% reply rate hiding a 9% SMB segment and a 0.5% enterprise segment is actively misleading. The average is the least useful number in the report.
- Report weekly cohorts, decide monthly. Weekly data catches deliverability incidents fast. Monthly aggregation is where you have enough volume to trust a copy or targeting conclusion. Making copy changes off three days of data is how teams thrash.
One more habit worth building: keep a change log next to the dashboard. Every domain added, mailbox warmed, sequence edited, and list source swapped, with a date. When reply rate drops 40% in a week, the log answers why in ten seconds. Without it you'll spend two days rewriting copy that was never the problem.
Where Should You Start This Week?#
Pick the layer that's currently unmeasured. For most teams that's layer 1 or layer 4 — deliverability is invisible until it collapses, and cohort analysis feels like a nice-to-have until the first time it reveals that one segment is carrying the entire pipeline.
A concrete 5-step start:
- Verify SPF, DKIM, and DMARC on every sending domain, and connect Postmaster Tools.
- Turn off open tracking on cold sequences. Remove open rate from the weekly report or footnote it.
- Re-verify your active list and record the invalid percentage. That's your baseline data-quality number.
- Add reply categorization — interested, not now, wrong person, hard no — and start reporting qualified reply rate.
- Stamp sequence ID, step, mailbox, and segment on every CRM record created from email.
None of that requires new budget. It requires deciding that the numbers should be true.
Start with the input layer. Clean, verified contact data is what makes every metric above it interpretable — bounce rate drops, denominators become honest, and your sender reputation stops absorbing damage from a list you never checked. Tomba Email Finder finds and verifies professional email addresses by domain, name, or company, with a free tier at 25 searches per month and Starter at $49/mo when you're ready to scale. Fix the data going in, and the analytics coming out will finally be worth reading.
Related guides#
Ready to find emails that actually work?
Join 150,000+ professionals who stopped guessing and started sending. Free credits on signup — no credit card required.
Get the Tomba newsletter
Practical outbound tactics and product updates — once every two weeks.
About the author