Email Campaign ROI: How to Measure It Properly in 2026
Open rates don't pay salaries. Here's the full email campaign ROI formula, the costs teams forget to count, realistic 2026 benchmarks, and how bad contact data quietly eats your return before the first send.
TL;DR
- Email campaign ROI is
(revenue attributed to email − total campaign cost) / total campaign cost. Everything else — opens, clicks, replies — is a leading indicator, not a return. - Most teams undercount cost by 40–60% because they only count the sending tool, not data, labor, domains, inboxes, and creative time.
- A realistic net ROI for a well-run B2B campaign in 2026 sits between 3x and 12x. Anything claiming 40x is usually counting gross revenue against tool cost alone.
- Bad contact data is the single largest hidden ROI drain: bounces burn sender reputation, which suppresses deliverability, which shrinks the denominator of every downstream metric.
- Model ROI per segment, not per campaign. One ICP segment usually carries the entire return while three others quietly lose money.
What is email campaign ROI, exactly?#
Email campaign ROI is the ratio of net profit generated by a campaign to the total cost of running it. It's the same return on investment math used anywhere else in finance, applied to a channel that most teams measure with engagement metrics instead of money.
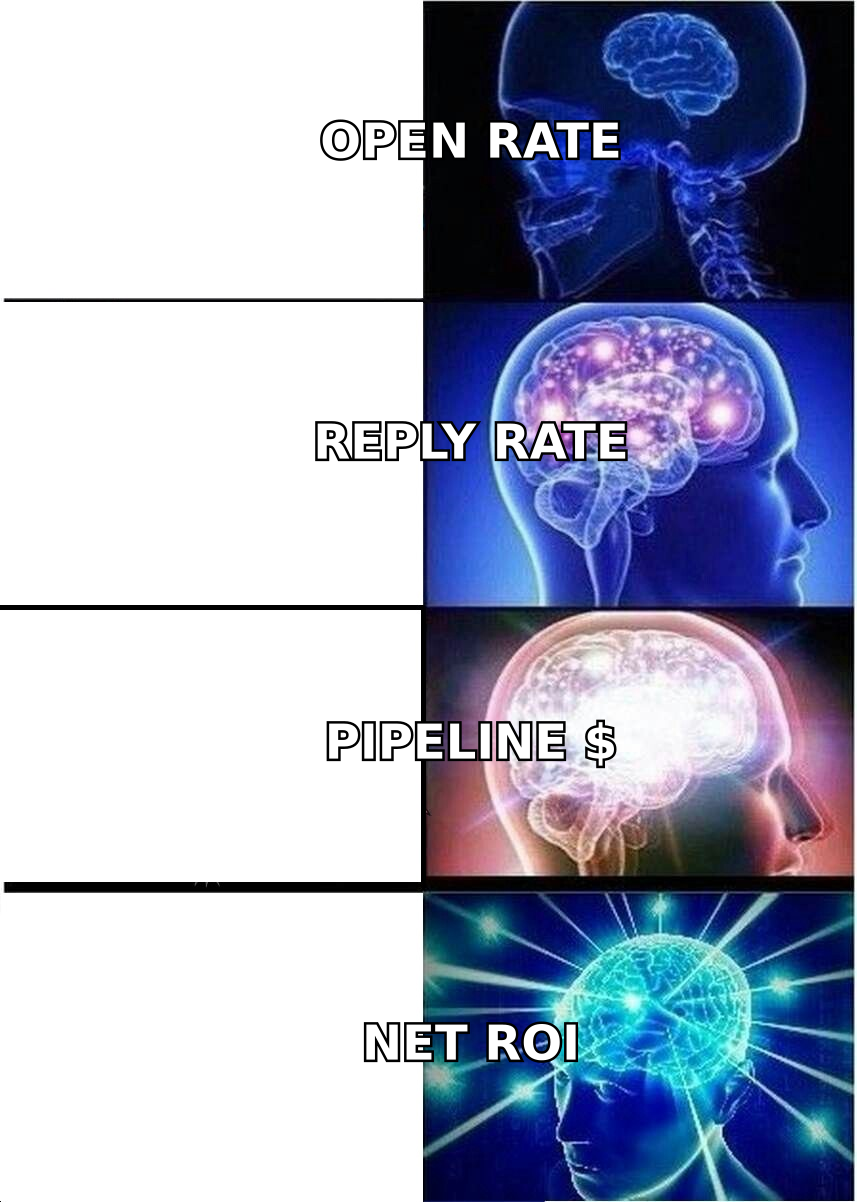
Here's the distinction that matters. Open rate tells you your subject line worked. Reply rate tells you your offer landed. Neither tells you whether the campaign made money. You can run a campaign with a 68% open rate, a 9% reply rate, and negative ROI — it happens constantly when the replies come from people who will never buy.
Think of it like a restaurant. Foot traffic is your open rate. Menu views are your clicks. Neither pays rent. Only the checks that clear do. Email campaign ROI is the check that clears, minus what it cost you to get the diner through the door.
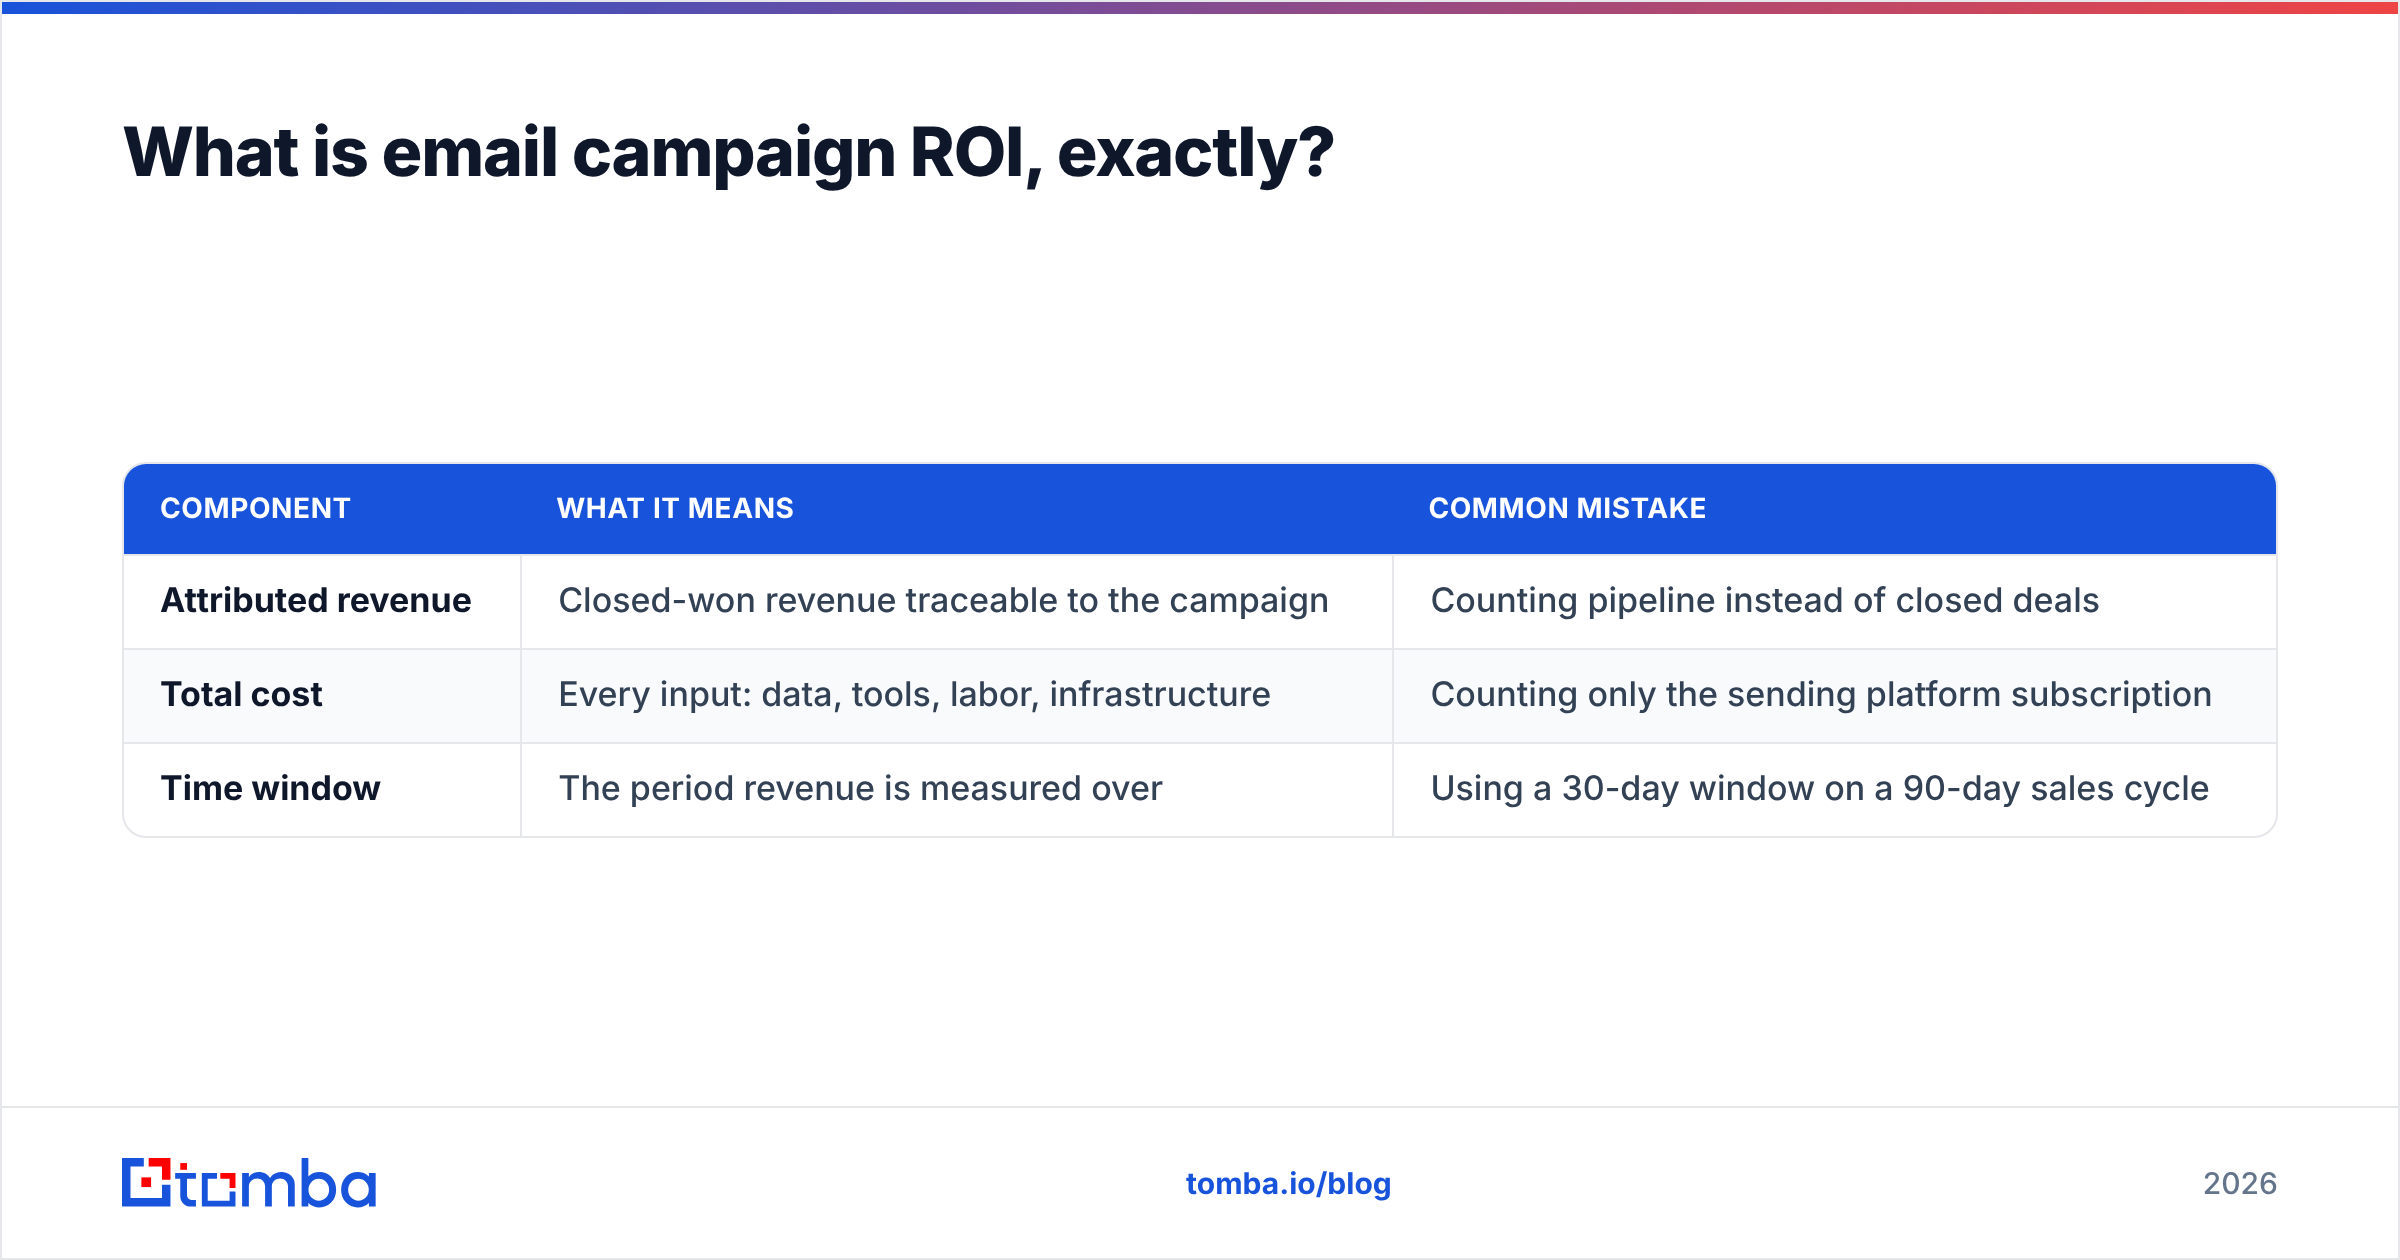
The three numbers you need:
| Component | What it means | Common mistake |
|---|---|---|
| Attributed revenue | Closed-won revenue traceable to the campaign | Counting pipeline instead of closed deals |
| Total cost | Every input: data, tools, labor, infrastructure | Counting only the sending platform subscription |
| Time window | The period revenue is measured over | Using a 30-day window on a 90-day sales cycle |
Get any of these wrong and the resulting number is theater.
What's the actual formula for email campaign ROI?#
The core formula:
ROI % = ((Attributed Revenue − Total Cost) / Total Cost) × 100For a campaign that generated $84,000 in closed-won revenue at a total cost of $11,500:
($84,000 − $11,500) / $11,500 = 6.30 → 630% ROI, or 7.3x returnBut raw revenue overstates things for most B2B businesses. If your gross margin is 72%, the honest version uses gross profit:
Margin-adjusted: (($84,000 × 0.72) − $11,500) / $11,500 = 4.26 → 426% ROIThat's a 46% swing from the same campaign. Which number you present depends on who's asking — a CFO will always want the margin-adjusted version, and presenting the gross one to a finance team is how marketing loses credibility.
A third variant matters if your sales cycle is long: payback-adjusted ROI, which discounts revenue that won't land for two or three quarters. If your average deal takes 94 days to close and you're reporting monthly, you're comparing this month's costs against last quarter's campaign revenue. Line up the cohorts or the number is noise.
Which costs do most teams leave out of the calculation?#
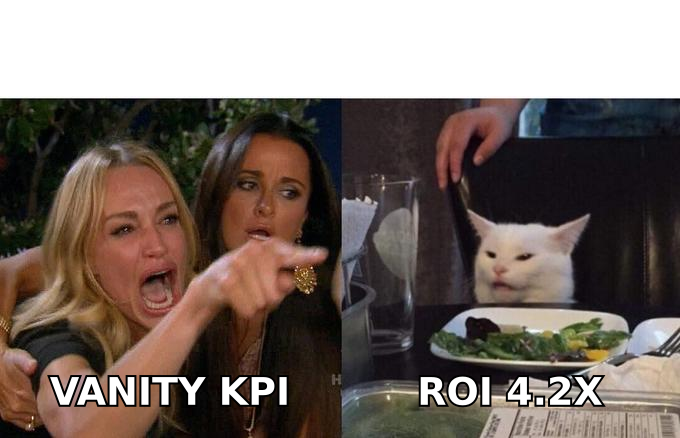
This is where ROI reports go fictional. The sending platform is usually the smallest line item, yet it's the only one that shows up in most spreadsheets.
- Contact data acquisition — credits for finding and verifying addresses, list purchases, enrichment costs. For a 5,000-contact campaign this is frequently $300–$1,200.
- Labor — hours spent on list building, copywriting, sequence setup, reply handling, and CRM hygiene. At a $65/hr fully-loaded rate, 40 hours is $2,600 — usually the single largest line.
- Infrastructure — secondary sending domains, extra mailboxes, warmup tooling, DNS configuration. Budget $8–$25 per mailbox per month, and serious outbound programs run 10–30 mailboxes.
- Deliverability remediation — the cost of blacklist removal, domain replacement, and the lost sends during a reputation recovery. This is $0 until it's suddenly $5,000.
- Opportunity cost of bad sends — every contact you burn with a mistargeted email is a contact you can't email again for six months. Rarely quantified, always real.
- CRM and attribution tooling — the prorated share of the systems that let you measure any of this in the first place.
Add those up and a campaign that looked like it cost $500 (the sending tool) usually costs $9,000–$14,000. The ROI doesn't disappear — it just becomes a number you can defend in a board meeting.
What does good email campaign ROI look like in 2026?#
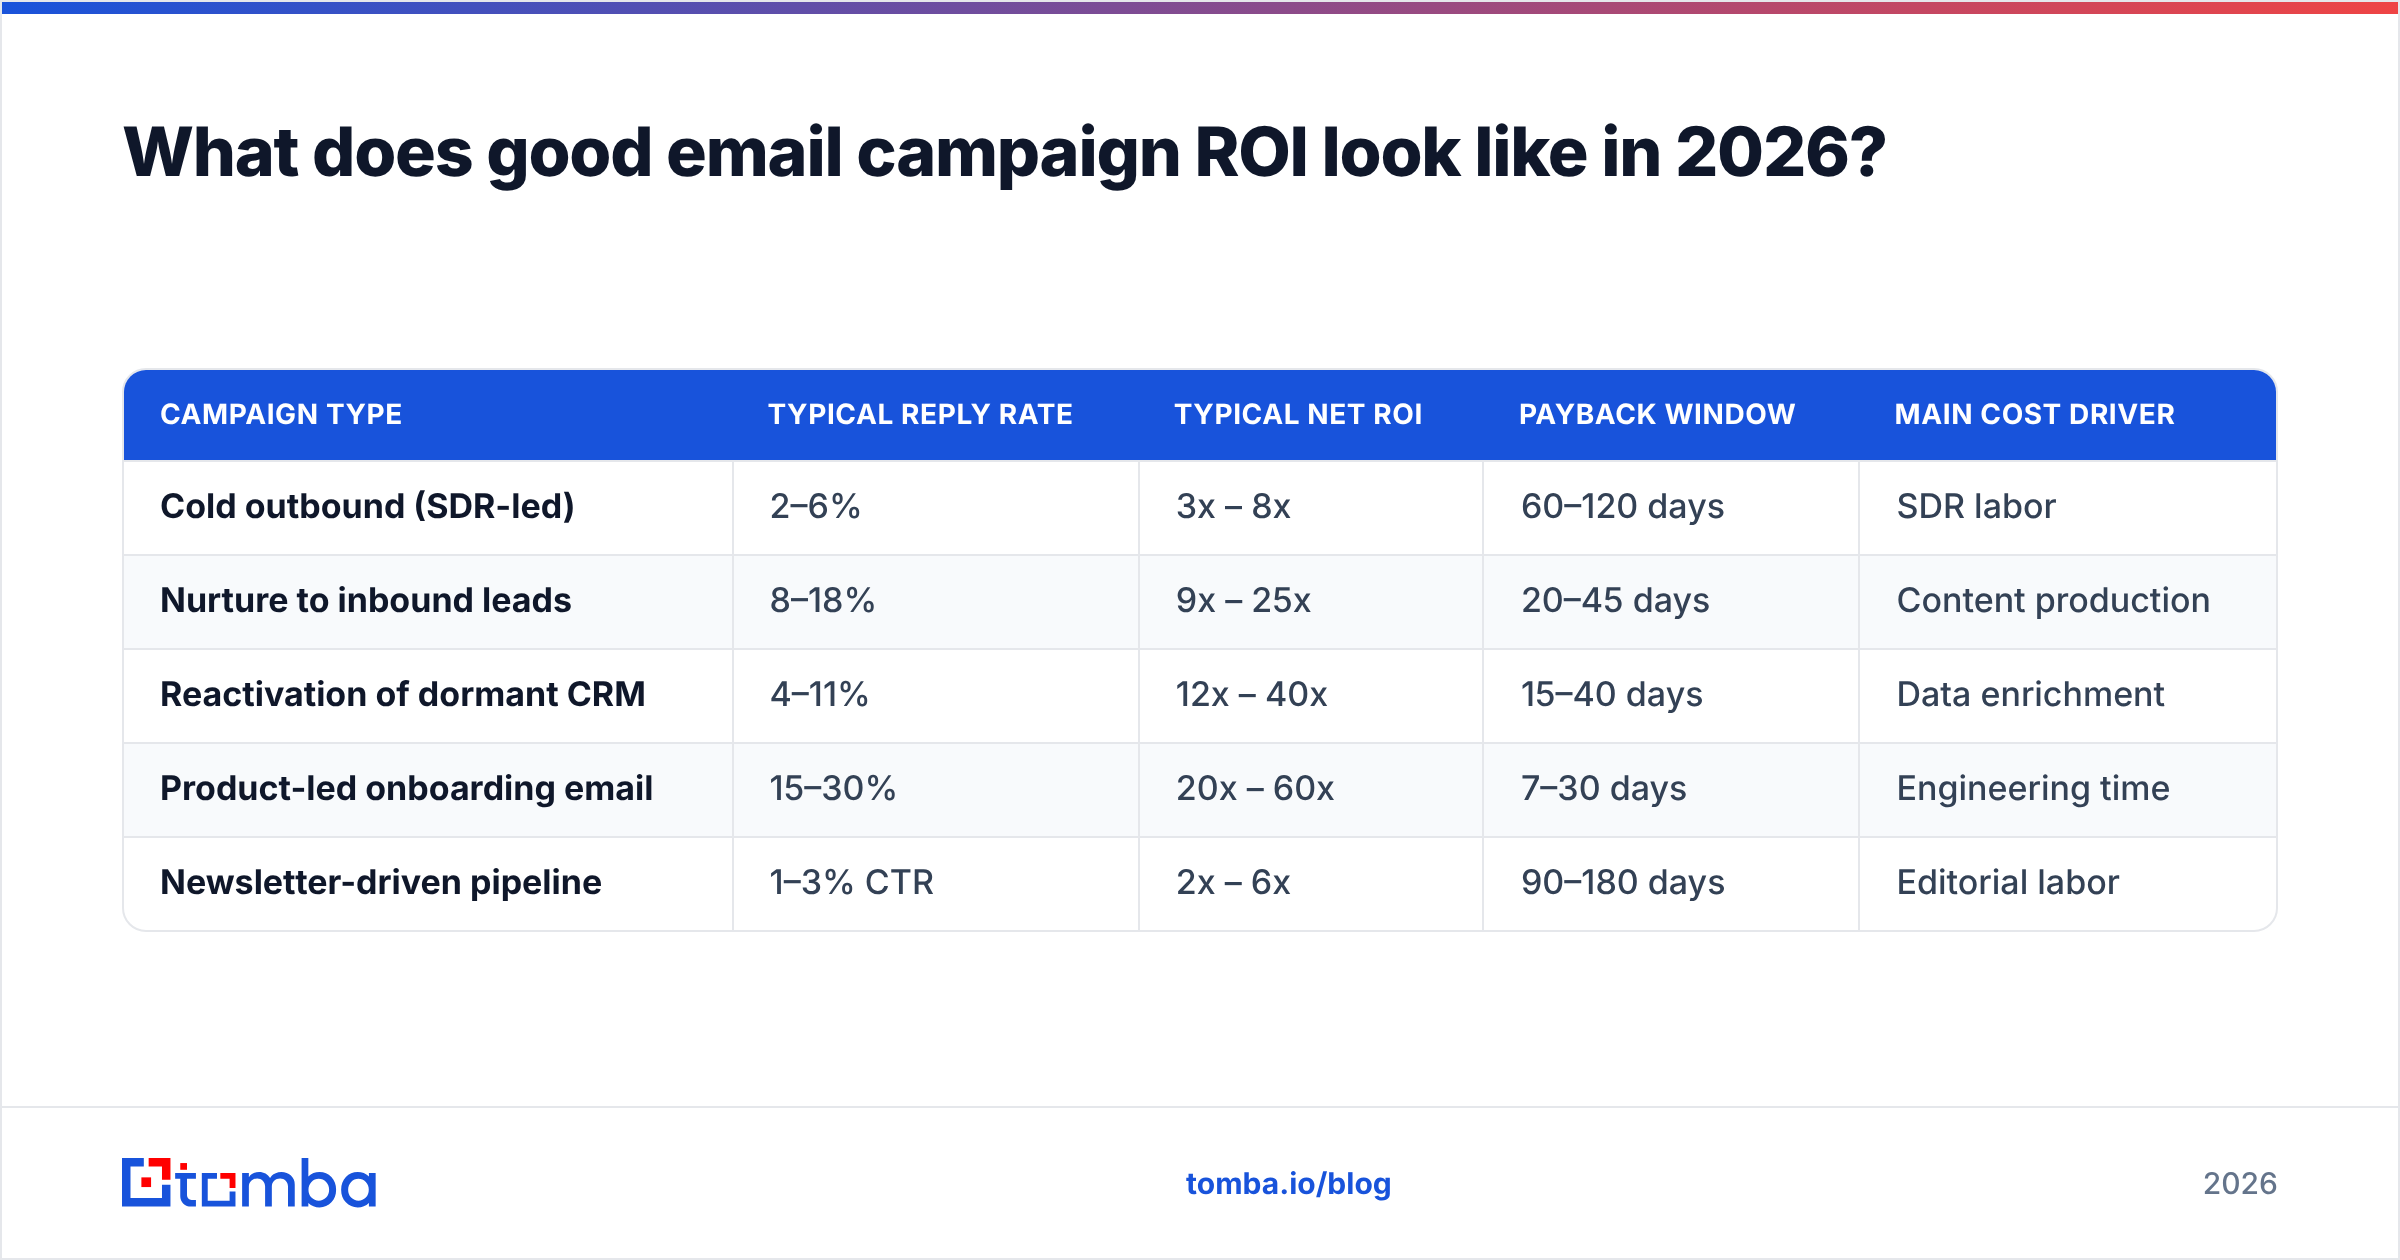
Benchmarks vary wildly by motion, so compare against the right column. These reflect commonly reported ranges across B2B teams; treat them as directional, not gospel.
| Campaign type | Typical reply rate | Typical net ROI | Payback window | Main cost driver |
|---|---|---|---|---|
| Cold outbound (SDR-led) | 2–6% | 3x – 8x | 60–120 days | SDR labor |
| Nurture to inbound leads | 8–18% | 9x – 25x | 20–45 days | Content production |
| Reactivation of dormant CRM | 4–11% | 12x – 40x | 15–40 days | Data enrichment |
| Product-led onboarding email | 15–30% | 20x – 60x | 7–30 days | Engineering time |
| Newsletter-driven pipeline | 1–3% CTR | 2x – 6x | 90–180 days | Editorial labor |
Two patterns jump out. First, campaigns to people who already know you outperform cold campaigns by a wide margin — reactivation is almost always the highest-ROI email work available, and almost always the least done. Second, cold outbound has the worst ratio and the longest payback, which is exactly why the data quality underneath it matters more than anywhere else.
If you want a broader baseline for engagement benchmarks across industries, HubSpot's marketing statistics library is a reasonable public reference point, and G2 category reviews are useful for sanity-checking vendor claims about lift.
Why does bad contact data destroy ROI before you send?#
Because it attacks the denominator and the numerator at the same time.
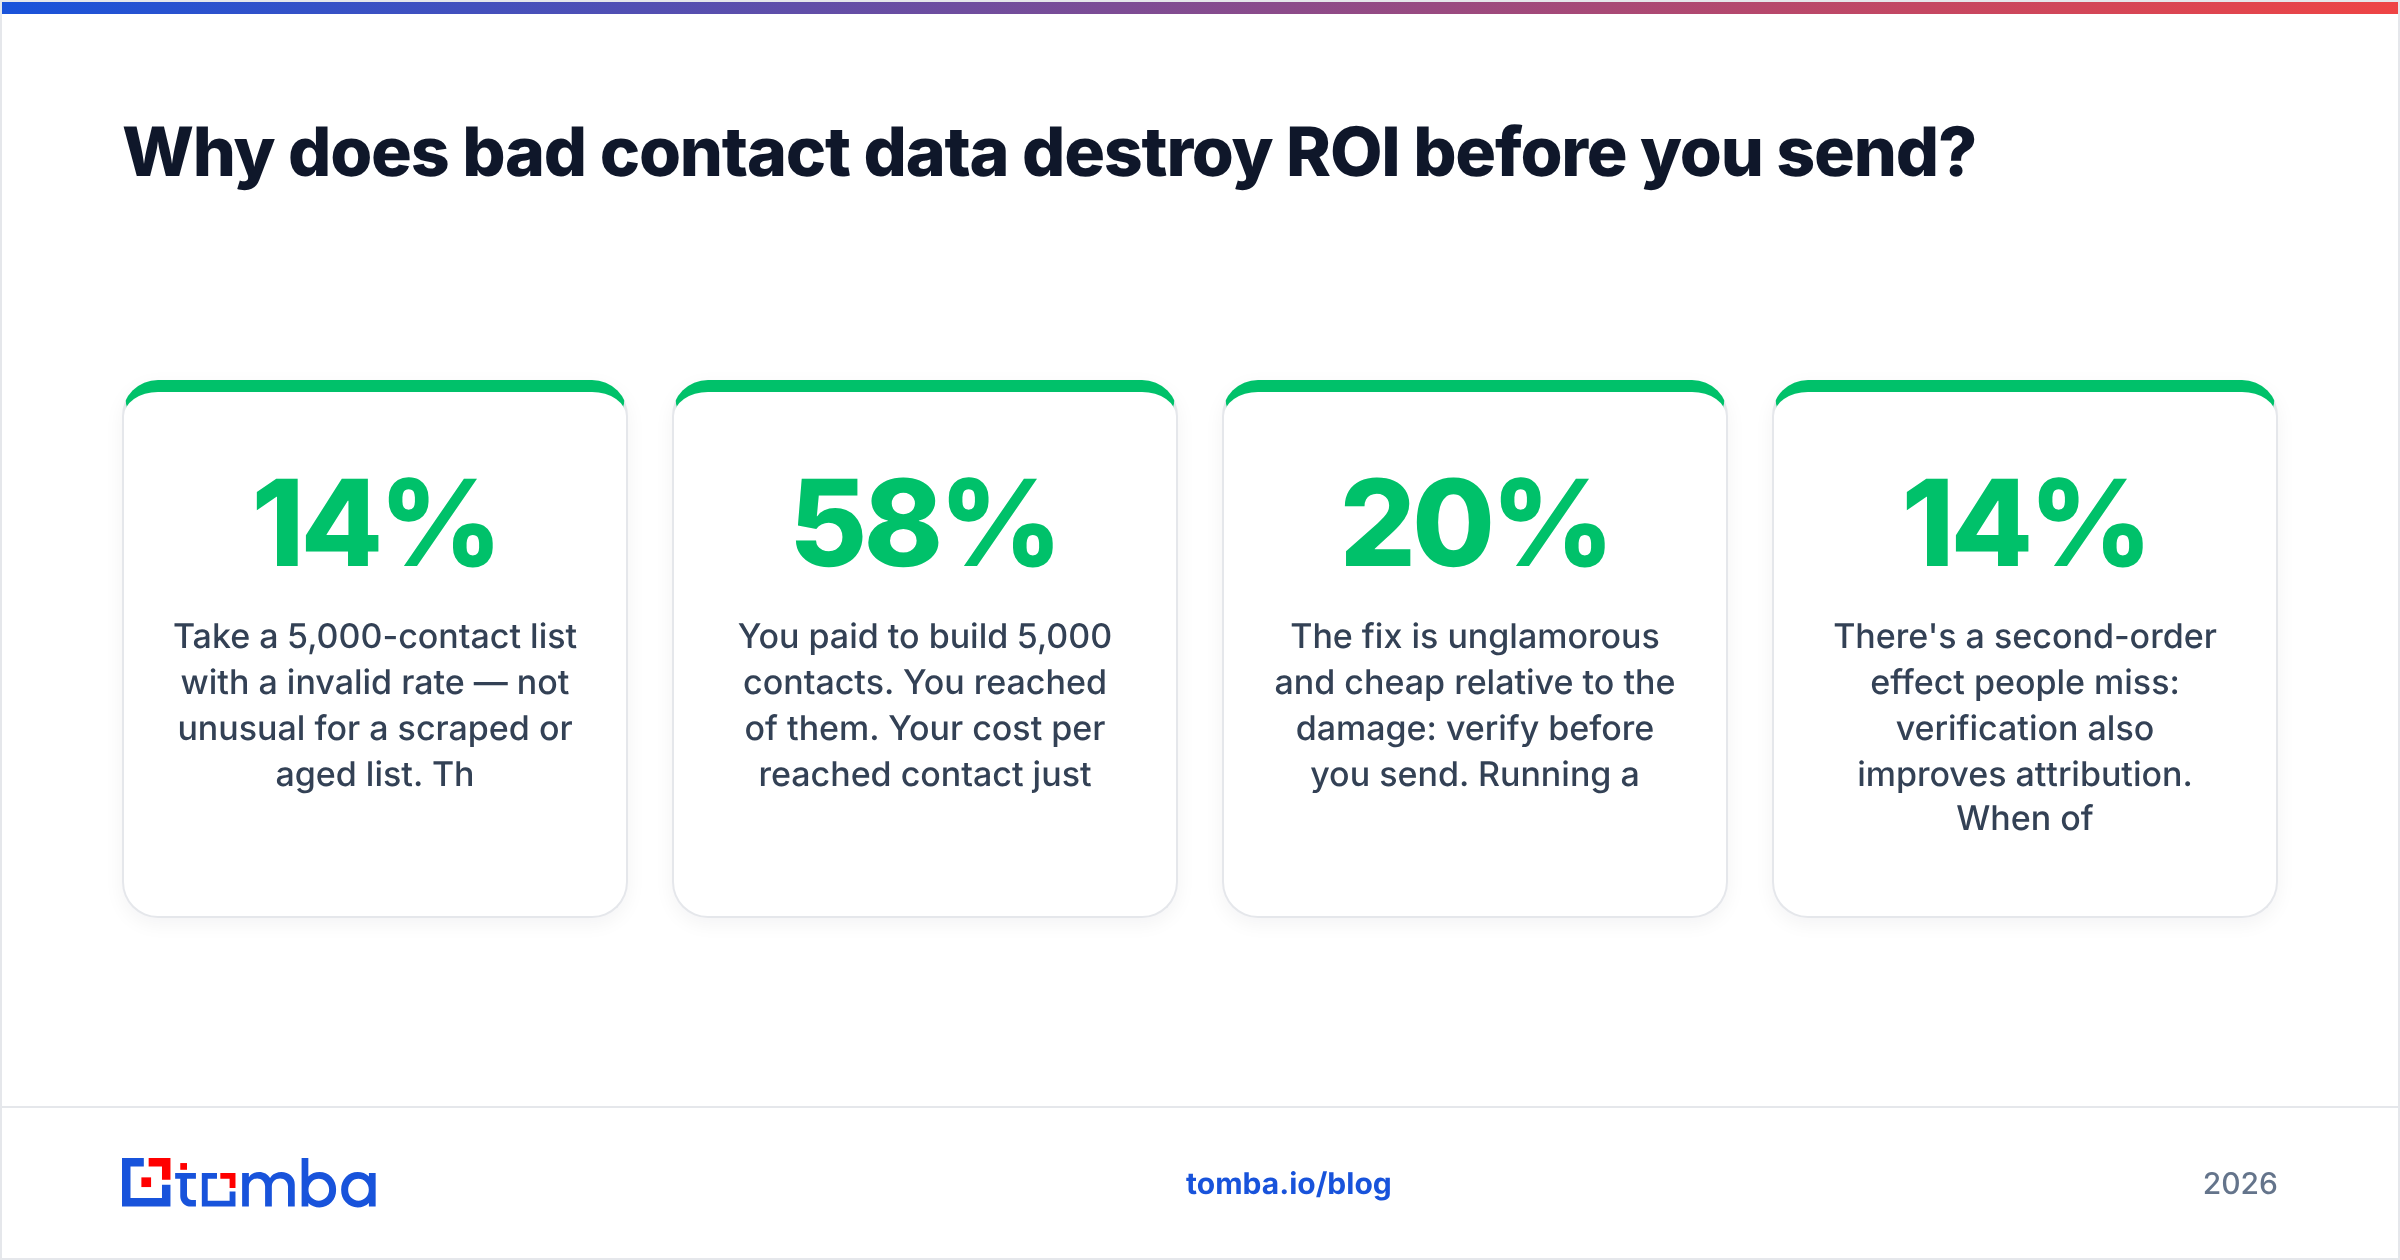
Take a 5,000-contact list with a 14% invalid rate — not unusual for a scraped or aged list. That's 700 hard bounces. Mailbox providers read a bounce rate above roughly 2% as a signal that you don't know who you're emailing. Above 5%, filtering tightens. The 4,300 valid addresses that remain now land in Promotions or spam at a materially higher rate, so your effective reach might be 2,900 inboxes instead of 5,000.
You paid to build 5,000 contacts. You reached 58% of them. Your cost per reached contact just went up 72%, and your reply count fell proportionally. That's the entire ROI story for most underperforming campaigns — not the copy, not the offer, the list.
The fix is unglamorous and cheap relative to the damage: verify before you send. Running a list through an email verifier costs a fraction of a cent per record and typically removes 8–20% of a list that felt fine. Catch-all domains need their own handling — a catch-all verifier distinguishes "the server accepts everything" from "this mailbox exists," which is the difference between a safe send and a silent bounce.
There's a second-order effect people miss: verification also improves attribution. When 14% of your list is garbage, your reply-rate denominator is inflated and every optimization decision you make afterward is based on a distorted baseline. Clean data doesn't just improve results — it makes results legible.
How do you build an ROI model you can actually defend?#
Work backwards from closed revenue, not forwards from sends.
Step 1 — Define the attribution rule before the campaign launches. First-touch, last-touch, or a time-decay model. Write it down. Changing it after you see results is how ROI reports become fiction.
Step 2 — Tag at the contact level, not the campaign level. Every contact should carry the campaign ID, segment, source, and verification status into the CRM. Without contact-level tagging you can't segment ROI, and segment-level ROI is where the actual insight lives.
Step 3 — Set a measurement window equal to 1.5x your median sales cycle. If deals close in 60 days, measure at 90. Reporting a 30-day ROI on a 60-day cycle guarantees you'll kill campaigns that were working.
Step 4 — Build a cost sheet per campaign, not per quarter. Six line items minimum: data, tools, labor, infrastructure, creative, and overhead allocation.
Step 5 — Report three numbers together. Gross ROI, margin-adjusted ROI, and cost per closed-won customer. The third number is the one executives actually remember.
Step 6 — Segment the report. Split ROI by ICP tier, company size, seniority, and data source. You will almost always find that one segment is subsidizing three losers.
Which tools change the ROI math, and by how much?#
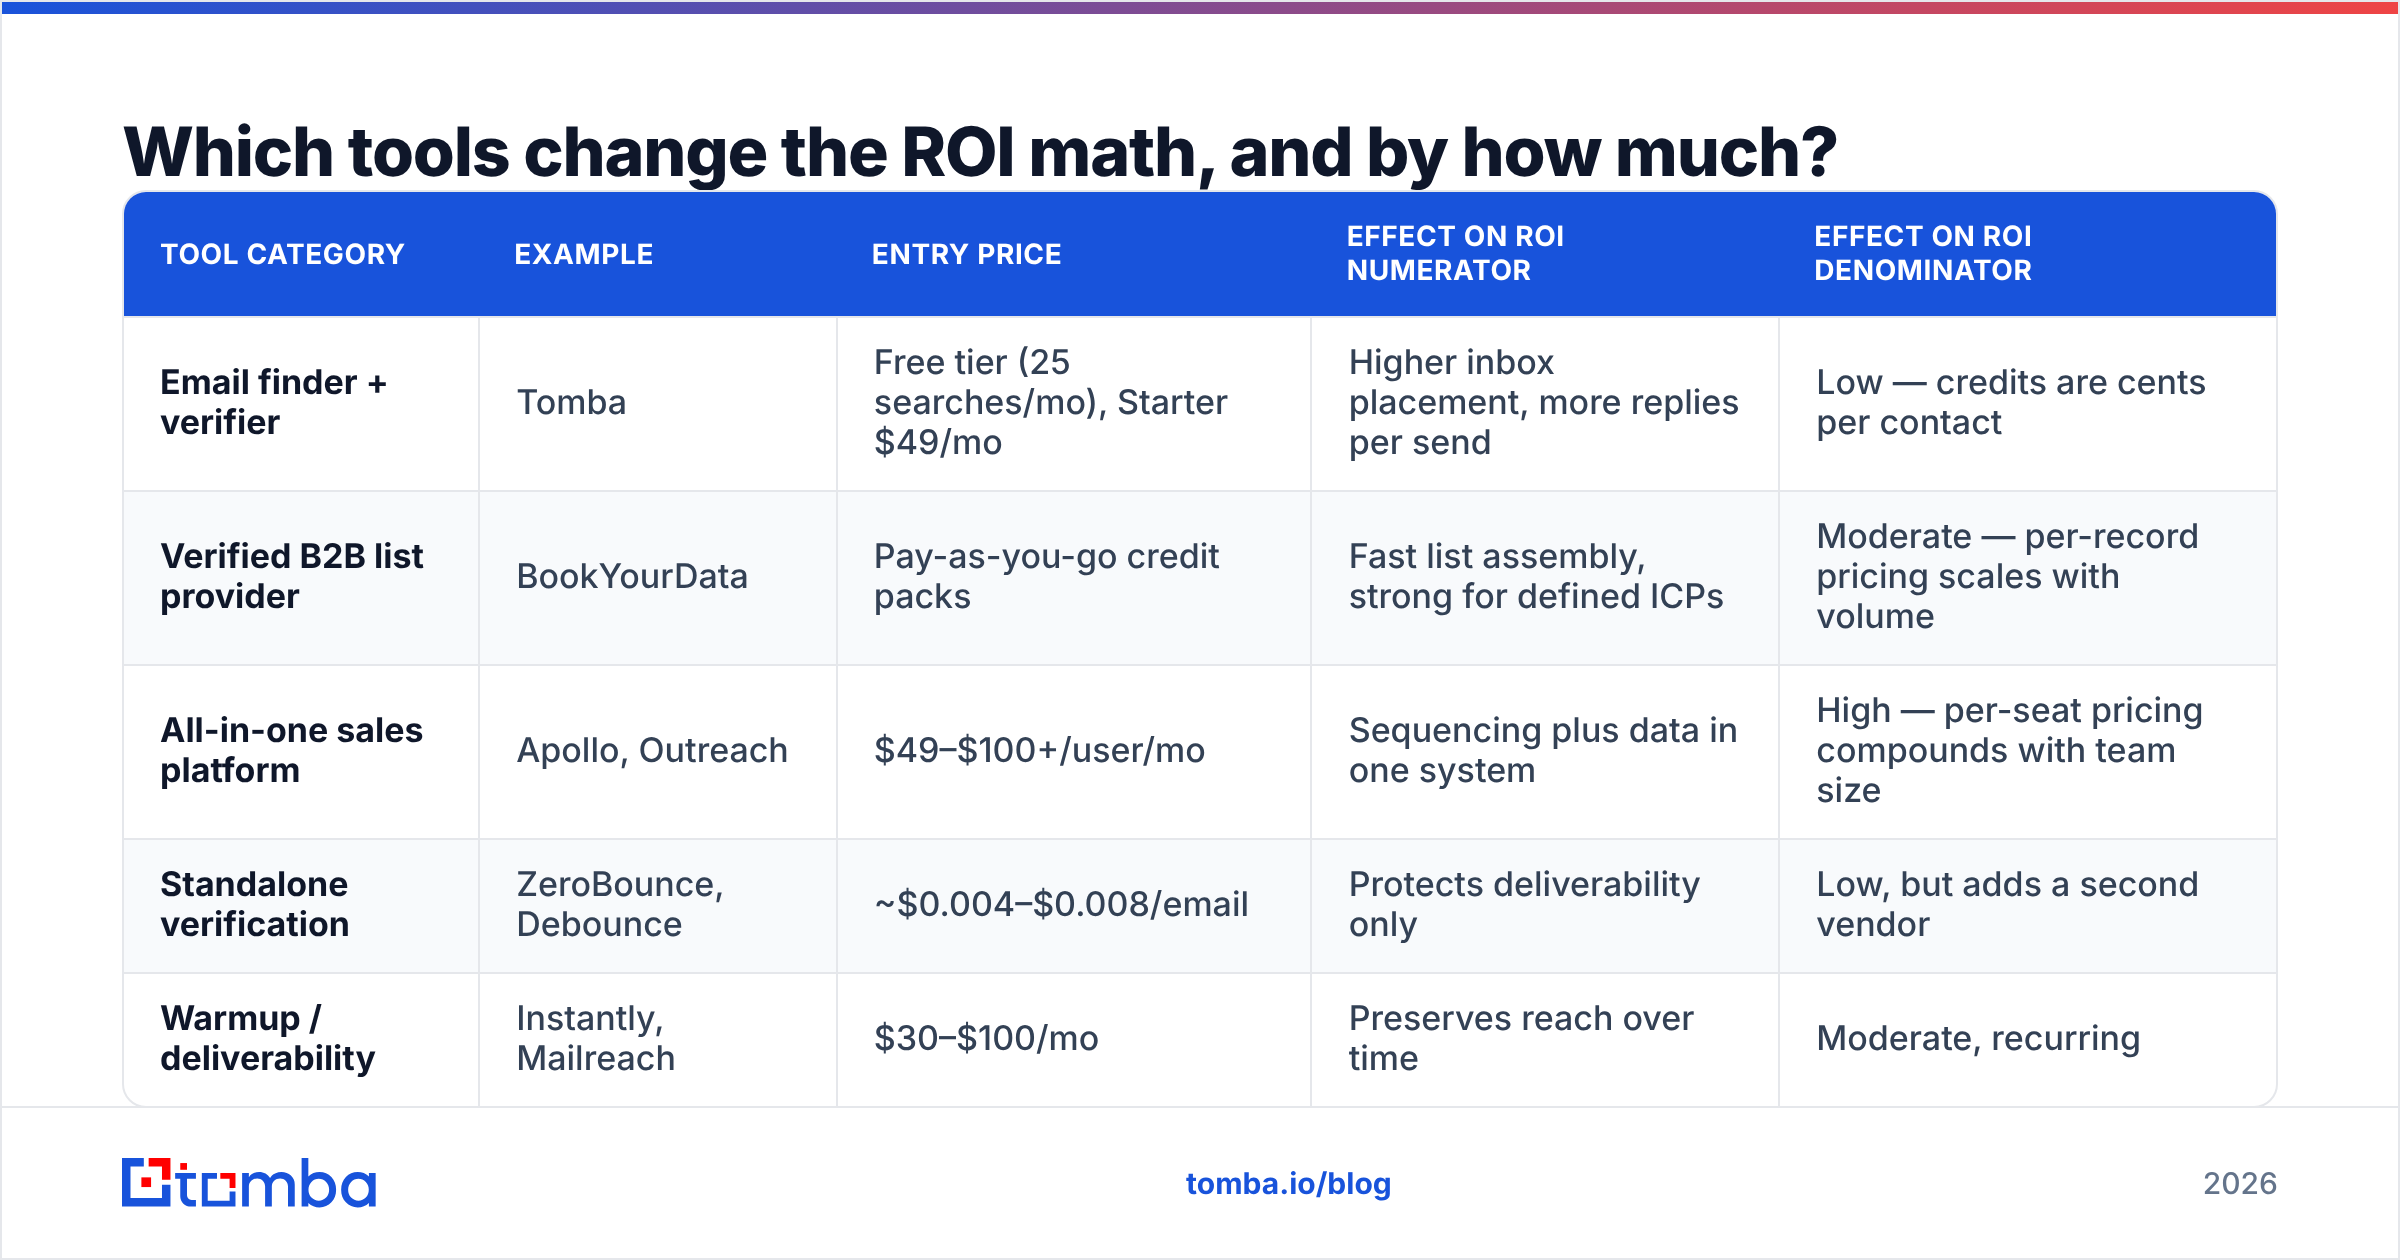
Tooling affects both sides of the equation — better data raises attributed revenue, cheaper data lowers cost. Here's how the main categories compare on cost structure. Prices are list prices at time of writing and change often; check each vendor directly.
| Tool category | Example | Entry price | Effect on ROI numerator | Effect on ROI denominator |
|---|---|---|---|---|
| Email finder + verifier | Tomba | Free tier (25 searches/mo), Starter $49/mo | Higher inbox placement, more replies per send | Low — credits are cents per contact |
| Verified B2B list provider | BookYourData | Pay-as-you-go credit packs | Fast list assembly, strong for defined ICPs | Moderate — per-record pricing scales with volume |
| All-in-one sales platform | Apollo, Outreach | $49–$100+/user/mo | Sequencing plus data in one system | High — per-seat pricing compounds with team size |
| Standalone verification | ZeroBounce, Debounce | ~$0.004–$0.008/email | Protects deliverability only | Low, but adds a second vendor |
| Warmup / deliverability | Instantly, Mailreach | $30–$100/mo | Preserves reach over time | Moderate, recurring |
A few honest observations. Per-seat platforms look expensive on paper but consolidate five tools — for a 10-person SDR team, that consolidation can win. For a 2-person team running targeted campaigns, per-seat pricing is the worst possible cost structure and credit-based tools like Tomba or BookYourData produce a far better cost-per-reached-contact. Both approaches are legitimate; the mistake is choosing based on feature lists instead of unit economics.
If you're evaluating specific swaps, comparisons like Apollo alternatives are useful for seeing where the cost lines cross. And if you're running lists in the thousands, bulk email finder workflows change the labor line more than the credit line — automating list assembly is usually worth more than saving $0.002 per record.
For teams building a repeatable process, check Tomba pricing against your monthly contact volume before committing to a seat-based contract. Credit-based models fit spiky campaign work; seat-based models fit steady daily prospecting.
How do you attribute revenue to email without inflating the number?#
Attribution is where ROI models go to die, because email rarely acts alone. A prospect gets an email, ignores it, sees a LinkedIn post two weeks later, then books a demo through your website. Who gets credit?
Three workable approaches, in increasing order of rigor:
- Last-touch before opportunity creation. Simple, defensible, undercounts email's nurture role. Good default for cold outbound where the email genuinely initiates contact.
- Time-decay multi-touch. Credit spreads across touches with recency weighted higher. More accurate, requires clean CRM data and contact-level tagging.
- Holdout testing. Withhold email from a randomized 10% of a matched segment and measure the revenue delta. This is the only method that measures true incremental lift rather than correlation. It costs you 10% of potential revenue and is worth every cent once a year.
Most teams should use last-touch for weekly reporting and run one holdout test per quarter to calibrate how much the last-touch number is over- or under-stating reality. If your holdout reveals that email is claiming credit for revenue that would have arrived anyway, you've learned something more valuable than another 2% on your open rate.
One more discipline: track response rate and ROI in the same view. When the two diverge — high replies, low ROI — you have a targeting problem, not a copy problem. When they move together, your ICP definition is sound and volume is the lever.
What should you fix first?#
Rank by cost-to-fix versus ROI impact:
- Verify your list — hours of work, immediate deliverability gain, cheapest fix available.
- Build a real cost sheet — one afternoon, permanently changes which campaigns you fund.
- Add contact-level campaign tagging — a day of CRM work, unlocks segment ROI forever.
- Extend your measurement window — free, and stops you killing campaigns that were about to pay back.
- Run one holdout test — costs a slice of revenue, buys you a number you can trust.
- Renegotiate or restructure tooling — highest effort, do it last, once you know your real unit economics.
Notice that four of six cost almost nothing. Email campaign ROI is rarely fixed by spending more; it's fixed by counting honestly and sending to people who exist.
Start with the data layer. Every ROI improvement downstream is capped by whether your emails reach real inboxes. The Tomba Email Finder finds verified professional addresses by domain, name, or company, with verification built into the same workflow — so your list is clean before it costs you a single point of sender reputation. The free tier gives you 25 searches a month to test the accuracy against a list you already trust, and paid plans start at $49/mo when you're ready to scale the campaigns that are actually working.
Related guides#
Ready to find emails that actually work?
Join 150,000+ professionals who stopped guessing and started sending. Free credits on signup — no credit card required.
Get the Tomba newsletter
Practical outbound tactics and product updates — once every two weeks.
About the author