Email Deliverability Report 2026: How to Read and Fix Yours
Most deliverability reports show you a 98% delivery rate while half your emails rot in spam. Here's how to read the numbers that actually matter, and the six metrics worth acting on.

TL;DR
- A "98% delivered" figure in your ESP dashboard only means the receiving server accepted the message. It says nothing about whether it landed in the inbox, Promotions, or spam.
- The six numbers worth reading every week: inbox placement rate, spam complaint rate, hard bounce rate, unique open rate by mailbox provider, unsubscribe rate, and domain/IP reputation trend.
- Google and Microsoft both enforce a 0.30% complaint ceiling for bulk senders. Google's own guidance is to stay under 0.10% — that is roughly 1 complaint per 1,000 sends.
- Split your report by mailbox provider (Gmail, Outlook, Yahoo, corporate M365). Aggregate numbers hide provider-specific collapses for weeks.
- Most deliverability problems trace back to list quality, not copy. Verifying addresses before send fixes more reports than rewriting subject lines does.
What is an email deliverability report?#
An email deliverability report is a periodic summary of how your sent mail actually performed on the receiving end — how much was accepted, how much bounced, how much was marked as spam, and (if you instrument it properly) how much reached the primary inbox rather than a junk folder.
Think of it like a delivery service scorecard. Your courier can tell you 98% of packages "arrived at the address." That is a shipping metric. What you actually want to know is how many were carried inside versus left in the rain on the porch. Most ESP dashboards report the first number and let you assume the second.
That gap is the whole reason deliverability reporting exists as a discipline. Your ESP measures SMTP acceptance. Mailbox providers make the folder decision after acceptance, based on signals your ESP cannot see: engagement history, complaint rate, authentication alignment, domain age, and content fingerprints.
Why does "98% delivered" mean almost nothing?#
Because delivery and placement are two different events.
When your sending server hands a message to Gmail's MX, Gmail responds with a 250 OK. Your ESP logs that as "delivered." Milliseconds later, Gmail's filtering stack decides whether the message goes to Primary, Promotions, Updates, or Spam. None of that decision is reported back to you.
So a campaign can show 98.4% delivered and 4% open rate simultaneously — not because your subject line was bad, but because 60% of it went to spam. The report looks healthy while the outcome is a disaster.
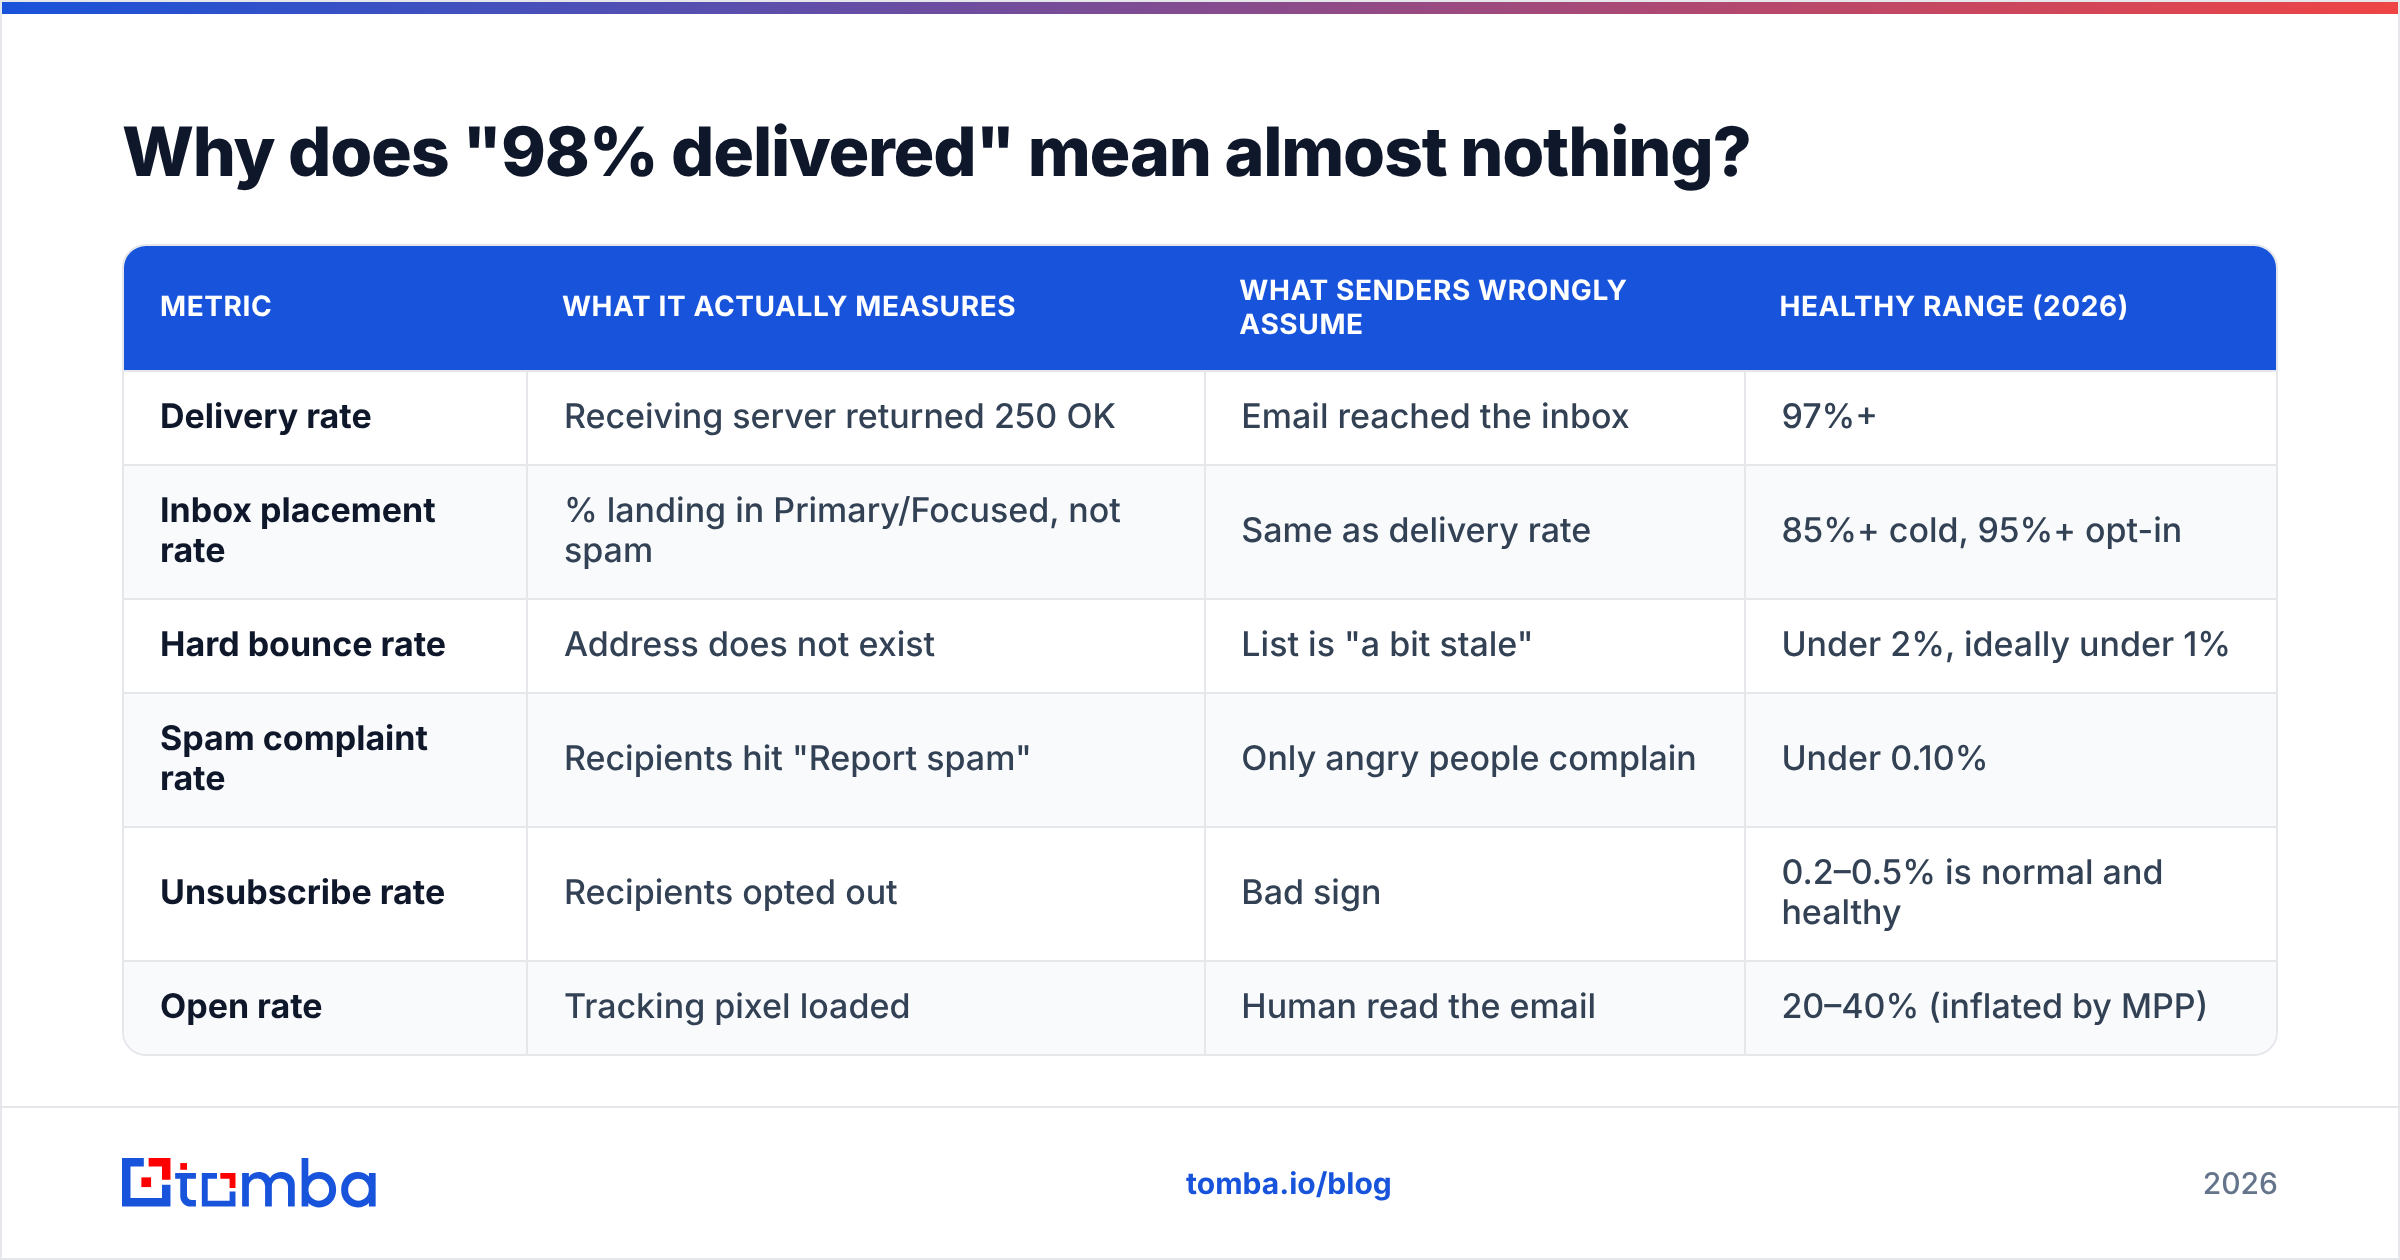
Here is what each metric actually measures versus what senders assume it measures:
| Metric | What it actually measures | What senders wrongly assume | Healthy range (2026) |
|---|---|---|---|
| Delivery rate | Receiving server returned 250 OK | Email reached the inbox | 97%+ |
| Inbox placement rate | % landing in Primary/Focused, not spam | Same as delivery rate | 85%+ cold, 95%+ opt-in |
| Hard bounce rate | Address does not exist | List is "a bit stale" | Under 2%, ideally under 1% |
| Spam complaint rate | Recipients hit "Report spam" | Only angry people complain | Under 0.10% |
| Unsubscribe rate | Recipients opted out | Bad sign | 0.2–0.5% is normal and healthy |
| Open rate | Tracking pixel loaded | Human read the email | 20–40% (inflated by MPP) |
The two rows that decide your fate are inbox placement and complaint rate. Everything else is diagnostic.

Which metrics belong in a useful email deliverability report?#
Six, in priority order. If your weekly report has more than eight numbers, nobody reads it.
- Inbox placement rate (IPR), split by provider. Measured with seed lists or a placement-testing vendor. This is the only metric that answers "did it land?" Track Gmail, Outlook/M365, Yahoo, and corporate domains separately — they behave nothing alike.
- Spam complaint rate, split by provider. Google Postmaster Tools gives you Gmail's number directly. Microsoft's SNDS covers Outlook/Hotmail. Anything over 0.30% is an enforcement trigger; over 0.10% is a warning sign you should act on this week.
- Hard bounce rate. Nonexistent mailboxes. Above 2% and providers read your list as purchased or unmaintained. This is the metric you can fix fastest and most completely — verification before send drives it near zero.
- Domain and IP reputation trend. Not the absolute value — the slope. A "High" reputation drifting to "Medium" over ten days is the earliest warning you get before placement collapses.
- Authentication pass rate. SPF, DKIM, and DMARC alignment percentages. Should be 100%. Anything less means some sending source is misconfigured and quietly poisoning your domain.
- Engagement decay curve. Open and reply rate by list age segment. When your 90-day-old contacts engage at a third the rate of fresh ones, providers notice before you do.
Add reply rate if you send cold outbound — it is the closest proxy to real inbox placement that requires no seed infrastructure. A campaign with 0.3% replies against a normal 4% baseline is almost certainly filtered, not badly written.
Where do you actually get this data?#
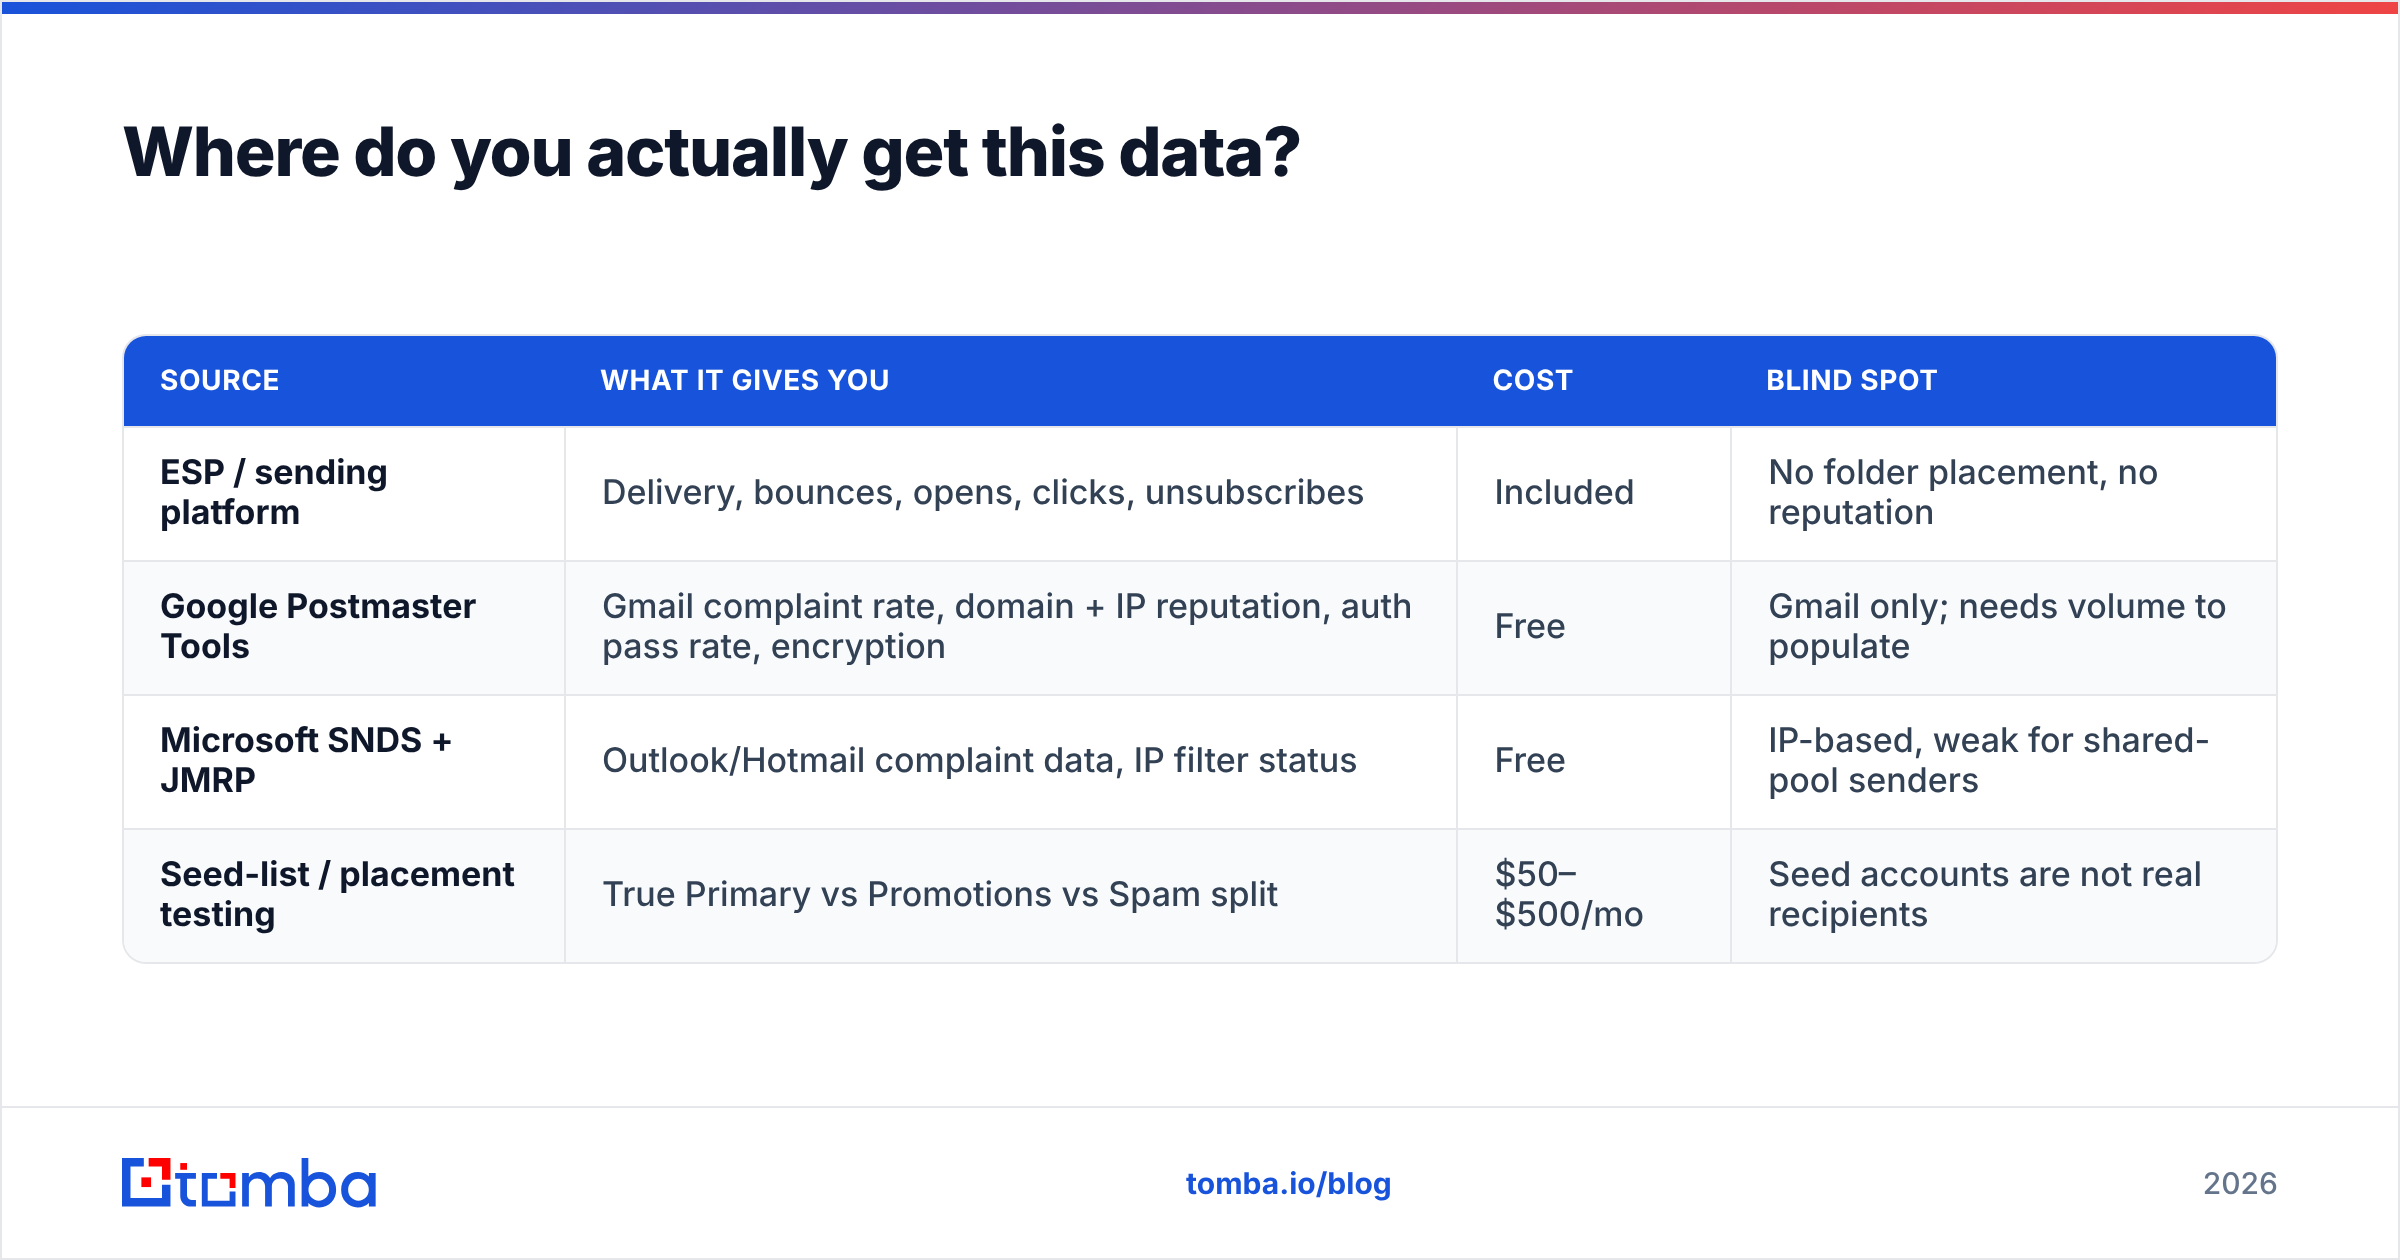
No single tool gives you all six. You assemble the report from four sources.
| Source | What it gives you | Cost | Blind spot |
|---|---|---|---|
| ESP / sending platform | Delivery, bounces, opens, clicks, unsubscribes | Included | No folder placement, no reputation |
| Google Postmaster Tools | Gmail complaint rate, domain + IP reputation, auth pass rate, encryption | Free | Gmail only; needs volume to populate |
| Microsoft SNDS + JMRP | Outlook/Hotmail complaint data, IP filter status | Free | IP-based, weak for shared-pool senders |
| Seed-list / placement testing | True Primary vs Promotions vs Spam split | $50–$500/mo | Seed accounts are not real recipients |
Set up Postmaster Tools first. It is free, it takes twenty minutes, and it is the closest thing to Gmail telling you directly what it thinks of you. If you send under a few thousand messages a day, the dashboard may stay sparse — but complaint rate and auth pass usually populate anyway.
For the seed-list layer, a placement test uses accounts you control at each provider. You send the campaign to them alongside the real list, then check which folder each landed in. It is a sample, not the truth — seed accounts have no engagement history — but the direction is reliable, and direction is what you act on.
Run a blacklist checker monthly against your sending IPs and domain too. Spamhaus or SURBL listings will not show up in your ESP report, and they explain sudden cliff-edge drops that no other metric predicts.
How do you read the report and find the actual problem?#
Work from the outcome backwards. Start with the symptom, then narrow.
Symptom: replies dropped, delivery rate unchanged. Almost always placement. Check complaint rate first, then reputation trend, then run a seed test. If Gmail placement is fine but Outlook collapsed, you have a Microsoft-specific issue — usually IP reputation on a shared pool or an SPF alignment failure.
Symptom: hard bounces spiked above 3%. List quality. Something changed in your sourcing — a scraped list, an old export, a CSV from a departed rep. Stop the campaign. Re-verify the list before another send, because bounce damage compounds: each bad send makes the next one worse.
Symptom: complaint rate crept from 0.05% to 0.25%. Relevance and consent, not technical config. You are reaching people who do not recognize you. Tighten targeting, shorten the sequence, make unsubscribe one click. Providers weigh complaints far heavier than any other negative signal — sender reputation recovers slowly from complaint damage.
Symptom: opens fell but clicks and replies held. Not a deliverability problem. That is Apple Mail Privacy Protection and image-blocking noise. Ignore it. This is exactly why open rate sits at position four in your report, not position one.
Symptom: everything good on aggregate, terrible on one domain family. Corporate M365 tenants with aggressive Defender policies. Check whether your links use a shortener, whether you attach files, and whether your sending domain is under 90 days old.
The discipline that separates a useful report from a vanity dashboard: change one variable per week. If you rotate copy, add a domain, and re-verify the list all at once, next week's report tells you nothing about which move worked.
How does list quality change every number in the report?#
More than anything else you control.
Bounces are the direct effect and the obvious one. The indirect effects are worse. Invalid addresses at Gmail and Outlook often route to spam traps or recycled addresses — accounts that were real, went dormant, and got repurposed as traps. Hitting one does more reputation damage than a thousand clean sends repair.
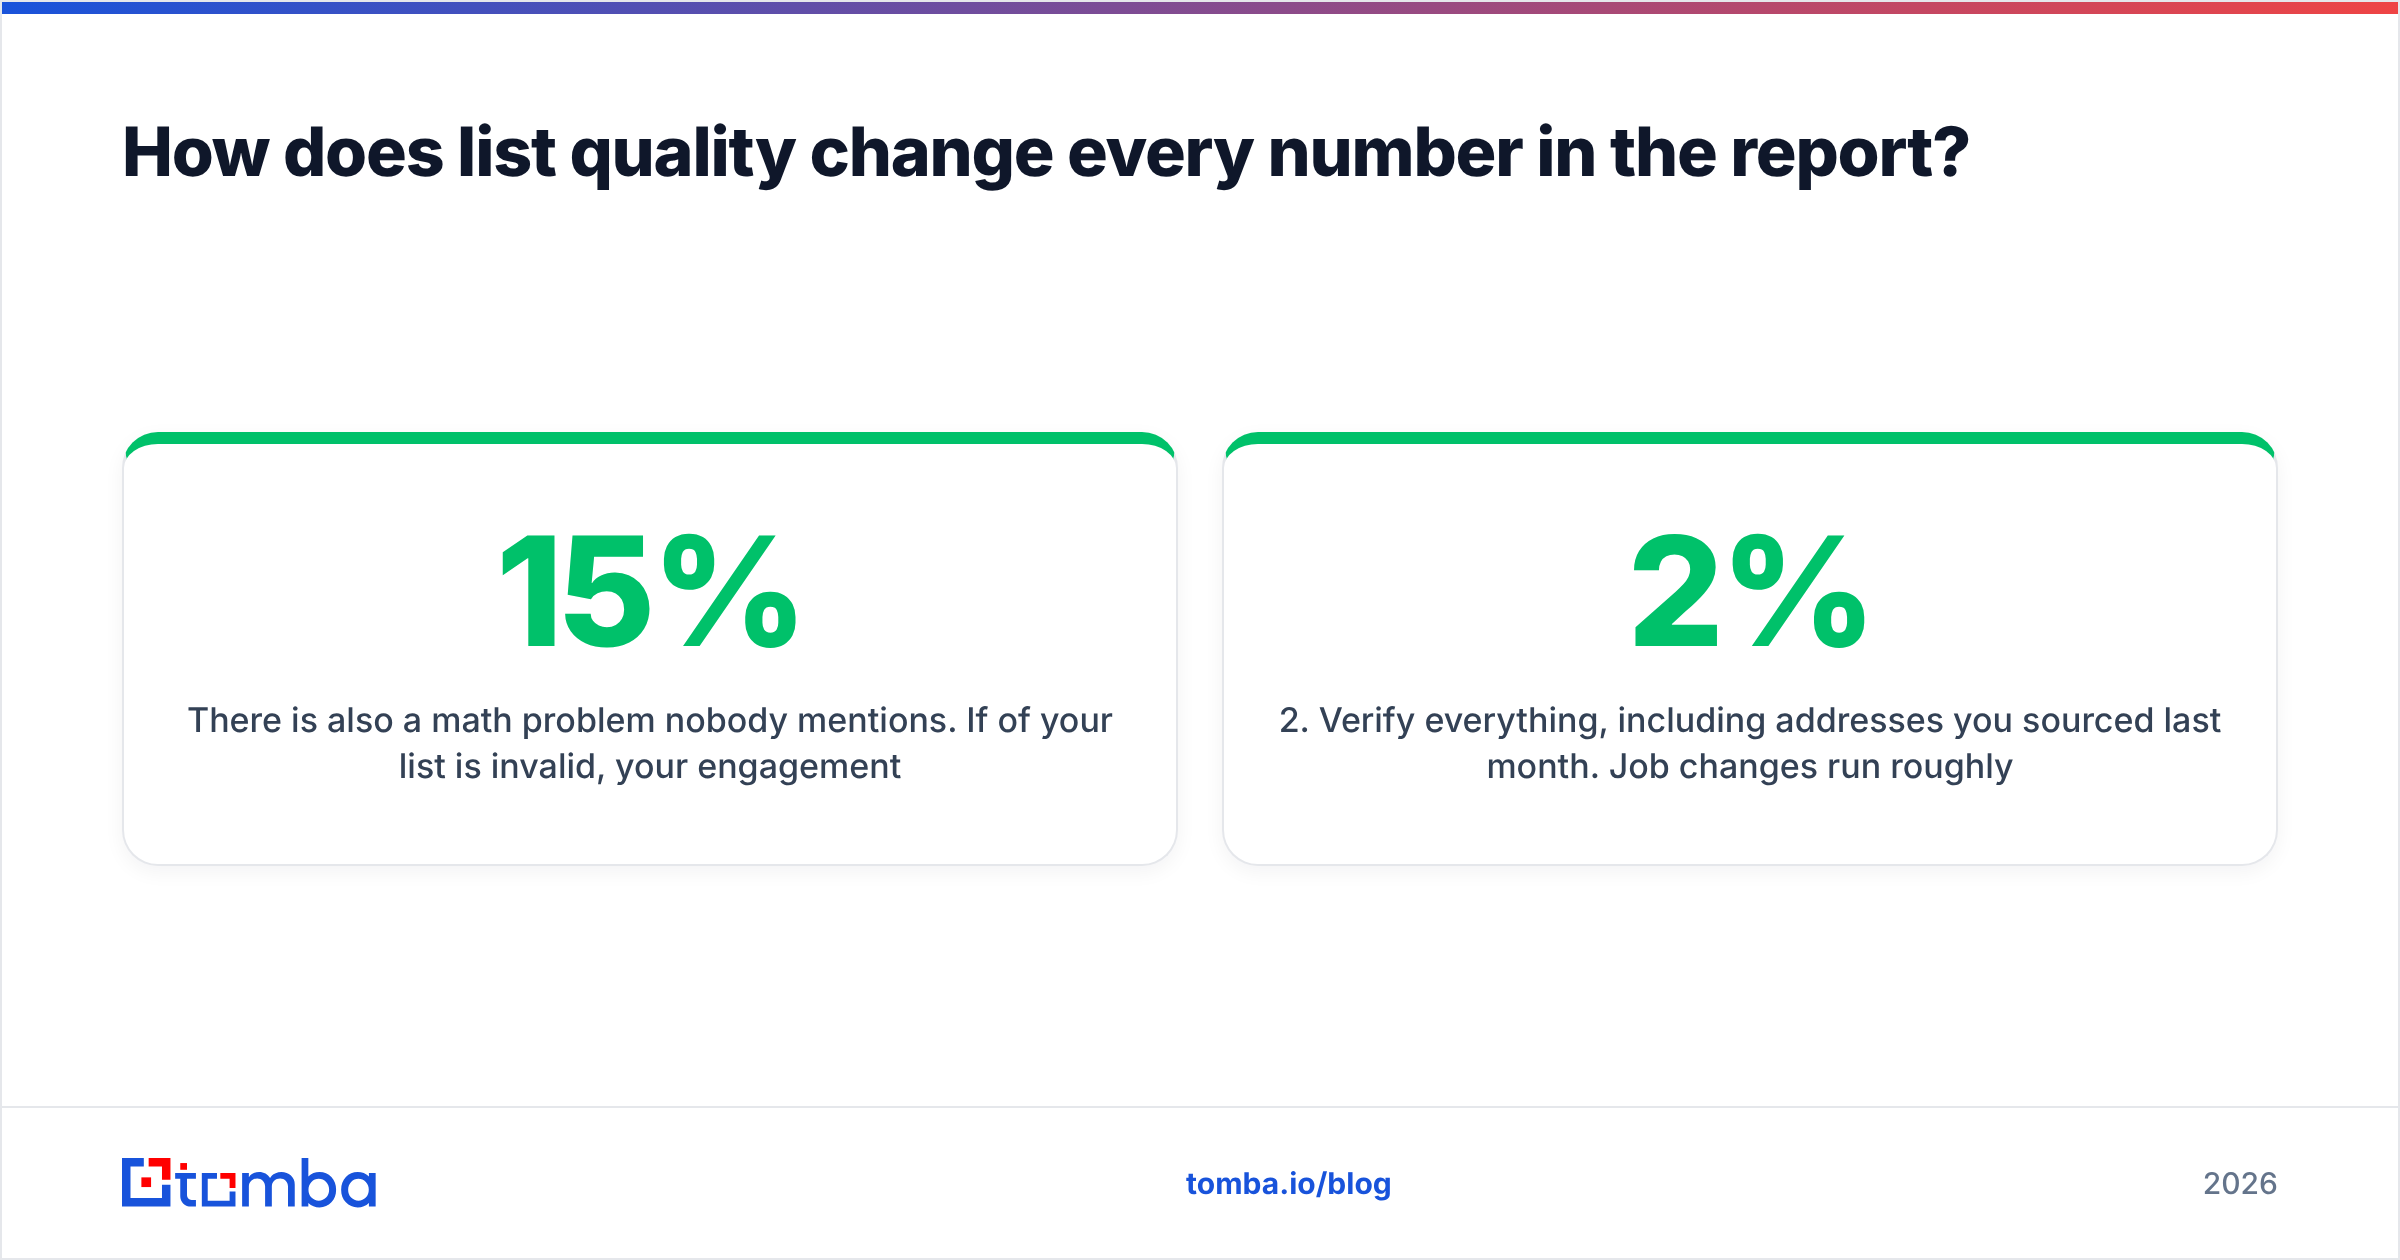
There is also a math problem nobody mentions. If 15% of your list is invalid, your engagement rates are computed against a denominator that includes ghosts. Your real open rate looks 15% worse than it is, so you "fix" copy that was never broken. Clean the list and your baseline metrics improve without a single content change — because the denominator got honest.
The practical sequence before any meaningful campaign:
- Source with pattern confidence, not guesses. A tool that returns a confidence score for each address beats permutation-and-hope. Tomba's email finder returns a score with each result so you can drop anything below your threshold before it enters the list.
- Verify everything, including addresses you sourced last month. Job changes run roughly 2% per month in B2B. A six-month-old list is meaningfully decayed. Run it through an email verifier before each major send.
- Handle catch-all domains separately. Catch-all servers accept everything, so standard verification returns "unknown." Segment them, send to them at lower volume, and use a catch-all verifier to score which are probably real.
- Suppress aggressively. Anyone who has not opened in 90 days is dead weight that drags your engagement signal down. Sunset them.
Vendors differ here more than their marketing suggests. BookYourData sells pre-verified B2B contacts with a bounce guarantee, which suits teams that want a list handed to them ready to send. Tomba sits closer to the build-your-own end — you find and verify against specific target accounts, which costs more effort and gives you tighter control over fit. Both are reasonable; the choice depends on whether your bottleneck is list volume or list precision.
How often should you run a deliverability report?#
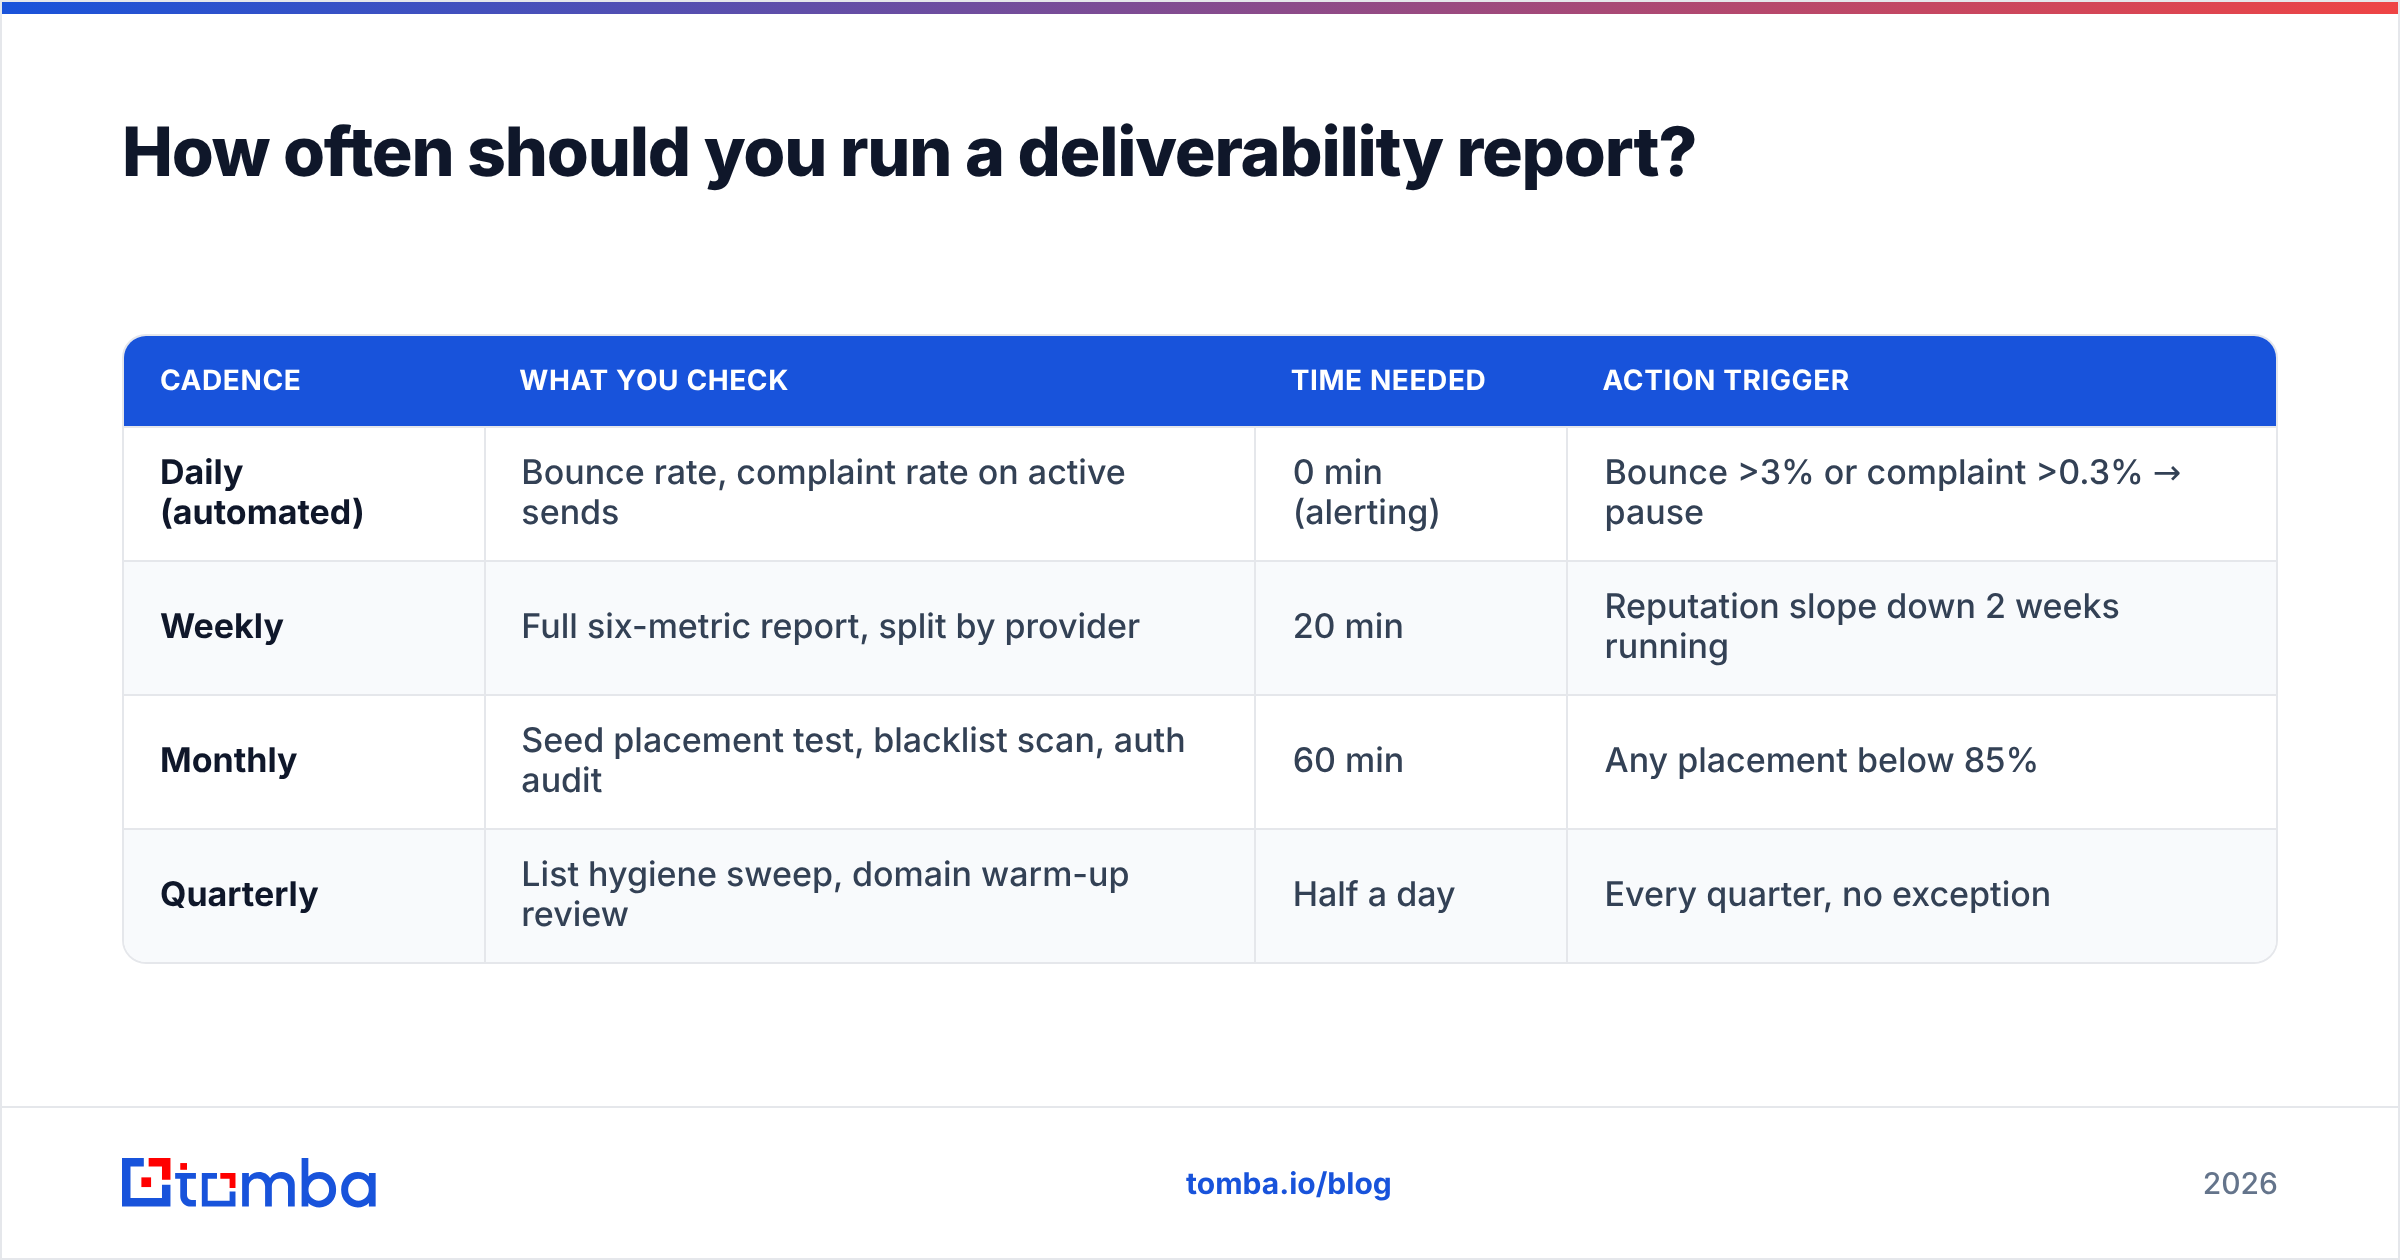
Three cadences, and mixing them up is why most teams either over-react or notice damage too late.
| Cadence | What you check | Time needed | Action trigger |
|---|---|---|---|
| Daily (automated) | Bounce rate, complaint rate on active sends | 0 min (alerting) | Bounce >3% or complaint >0.3% → pause |
| Weekly | Full six-metric report, split by provider | 20 min | Reputation slope down 2 weeks running |
| Monthly | Seed placement test, blacklist scan, auth audit | 60 min | Any placement below 85% |
| Quarterly | List hygiene sweep, domain warm-up review | Half a day | Every quarter, no exception |
Daily should be alerts, not a dashboard someone remembers to open. Set the thresholds once and let them page you. The weekly report is the one a human reads and acts on. The monthly test is where you catch problems that leave no trace in ESP data.
One structural note: if you send from multiple domains, report per domain. Aggregating across sending domains is the single most common reporting mistake, and it hides the exact thing you set the domains up to isolate.
What should you do in the first week?#
If you are starting from nothing, this order gets you the most signal for the least work:
- Day 1 — Verify SPF, DKIM, and DMARC on every sending domain. Use an SPF checker and confirm DMARC is at least
p=nonewith reporting on. Free, fast, and roughly a third of "mysterious" deliverability problems die here. - Day 2 — Connect Google Postmaster Tools and Microsoft SNDS. Data starts accumulating from the day you connect, so the sooner the better.
- Day 3 — Export your active list and run full verification. Record the invalid percentage. That number is your baseline and usually your biggest lever.
- Day 4 — Run a seed placement test on your highest-volume campaign. Note the Primary/Promotions/Spam split per provider.
- Day 5 — Build the weekly report template with the six metrics, split by provider. One page. If it needs scrolling, cut something.
By the end of that week you will know whether your problem is authentication, list quality, reputation, or content — and those four require completely different fixes. Most teams guess wrong because they never separated them.
Where does deliverability reporting go from here?#
Two shifts are worth planning around. First, open-rate data keeps degrading as privacy protections expand, which pushes reply rate and click rate into the primary-signal role that opens used to hold. Build your reporting around them now rather than after opens become fully unusable.
Second, mailbox providers keep tightening bulk-sender requirements. The 2024 Google and Yahoo rules — required authentication, one-click unsubscribe, enforced complaint thresholds — set a floor that has only risen since. Assume the requirements get stricter and the enforcement more automated. Senders with clean lists and stable engagement barely notice these changes. Senders relying on volume feel each one as a cliff.
The through-line: your deliverability report is a lagging indicator of decisions you made weeks earlier about who you contacted and how you got their address. Reporting tells you where you stand. List quality determines where you end up.
Start with the input, not the dashboard. Most deliverability reports that look bad are describing a list problem, and the cheapest fix is not sending to bad addresses in the first place. Tomba's Email Finder returns a confidence score with every address so you can filter before you build the campaign, and the verifier catches what slips through. The free tier includes 25 searches a month if you want to test the accuracy against a list you already know; paid plans start at $49/mo on Starter, with Growth at $99/mo — full Tomba pricing is public. Clean the input, and the report mostly fixes itself.
Related guides#
Ready to find emails that actually work?
Join 150,000+ professionals who stopped guessing and started sending. Free credits on signup — no credit card required.
Get the Tomba newsletter
Practical outbound tactics and product updates — once every two weeks.
About the author