Email Open Rate Benchmarks 2026: Real B2B Numbers by Industry
Open rates have been inflated since 2021, and most benchmark reports still quote the broken number. Here are realistic 2026 open rate benchmarks by industry, what they hide, and which metrics you should actually report on.
TL;DR
- Most published email open rate benchmarks are inflated by 10-25 percentage points because privacy proxies pre-fetch tracking pixels and register a machine action as a human open.
- Realistic 2026 ranges: 30-45% reported opens for B2B marketing email, 15-35% for cold outbound, but only 8-20% of those are verifiable human opens.
- Reply rate, click-to-open on non-proxy clients, and bounce rate are more decision-useful than raw open rate.
- Bounce rate above 3% will crush open rate faster than any subject line will lift it — list hygiene beats copywriting on the margin.
- Benchmark yourself against your own trailing 90 days, segmented by sending domain and audience type. Cross-industry averages are context-free.
What are email open rate benchmarks in 2026?#
An email open rate benchmark is the average percentage of delivered emails recorded as "opened" across a defined population — an industry, a list size band, or a send type. The number is produced by a 1x1 tracking pixel loading in the recipient's client.
That mechanism broke in September 2021, and nobody has fully repaired it. Apple Mail Privacy Protection pre-loads images for every message routed through Apple Mail, regardless of whether the recipient ever looks at it. Gmail's image proxy caches images similarly. Corporate security gateways detonate links and load assets in a sandbox before delivery. Each of those events fires your pixel.
The result: your reporting dashboard shows a number that combines three populations — humans who read the email, humans who never saw it but whose client fetched the pixel anyway, and machines. You cannot separate them from the aggregate. Neither can the vendors publishing benchmark reports, which is why you should treat every open rate chart published since 2022 as an upper bound rather than a measurement. Email tracking as a discipline has been degrading for five years, and the trend is one-directional.
This matters commercially. If your board deck reports 42% opens and your actual human readership is 17%, every downstream forecast built on that funnel — meetings booked per 1,000 sends, cost per opportunity, rep capacity planning — is wrong by a factor of two.

Which email metrics can you still trust?#
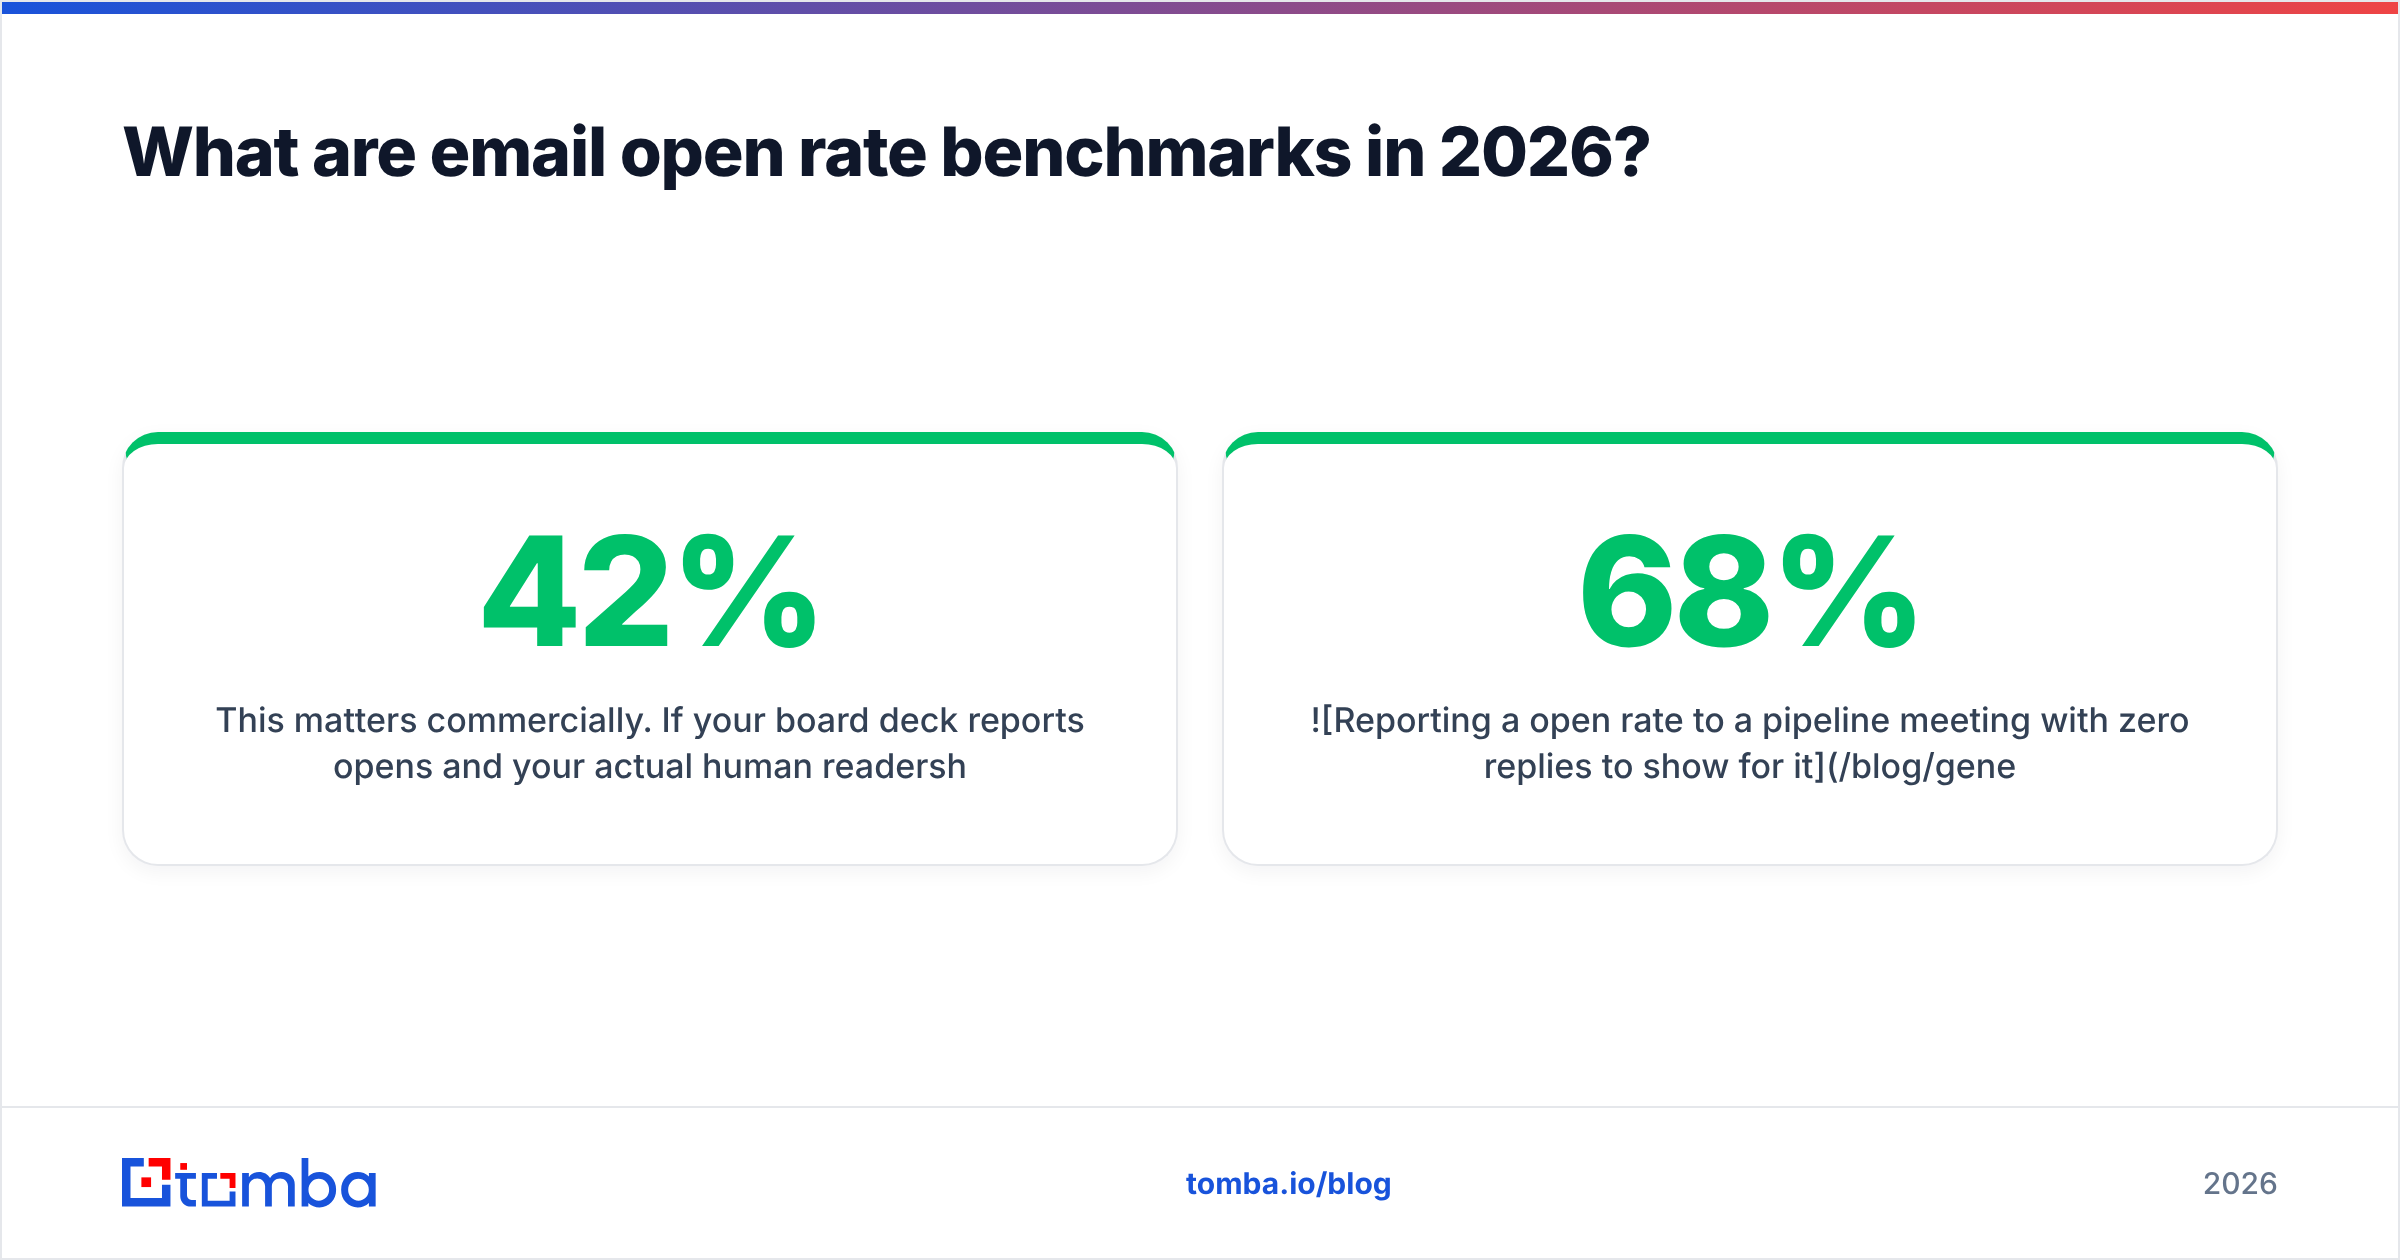
Here is how the core outbound metrics rank on reliability in 2026, and what each one is actually good for.
| Metric | What it measures | Trust level in 2026 | Best used for |
|---|---|---|---|
| Open rate | Pixel loads on delivered mail | Low — inflated by proxies and gateways | Directional trend on a single domain over time |
| Click rate | Unique link clicks per delivered email | Medium — bot-clicked by security scanners | Comparing two CTAs in the same send |
| Reply rate | Human responses per delivered email | High — very hard to fake | Judging offer-market fit and copy quality |
| Bounce rate | Hard + soft bounces per attempt | High — server-reported | List quality and sender health |
| Meetings booked | Calendar events attributed to sequence | Highest | Actual revenue forecasting |
| Spam complaint rate | Recipient-flagged messages | High — reported by mailbox providers | Early warning on reputation damage |
The practical rule: use open rate to detect a change on your own infrastructure, and never to compare yourself to another company. A drop from 38% to 12% on the same domain in the same week is a real signal — something broke. A gap between your 31% and a competitor's claimed 61% is noise, different measurement, or marketing.
What is a good email open rate by industry?#
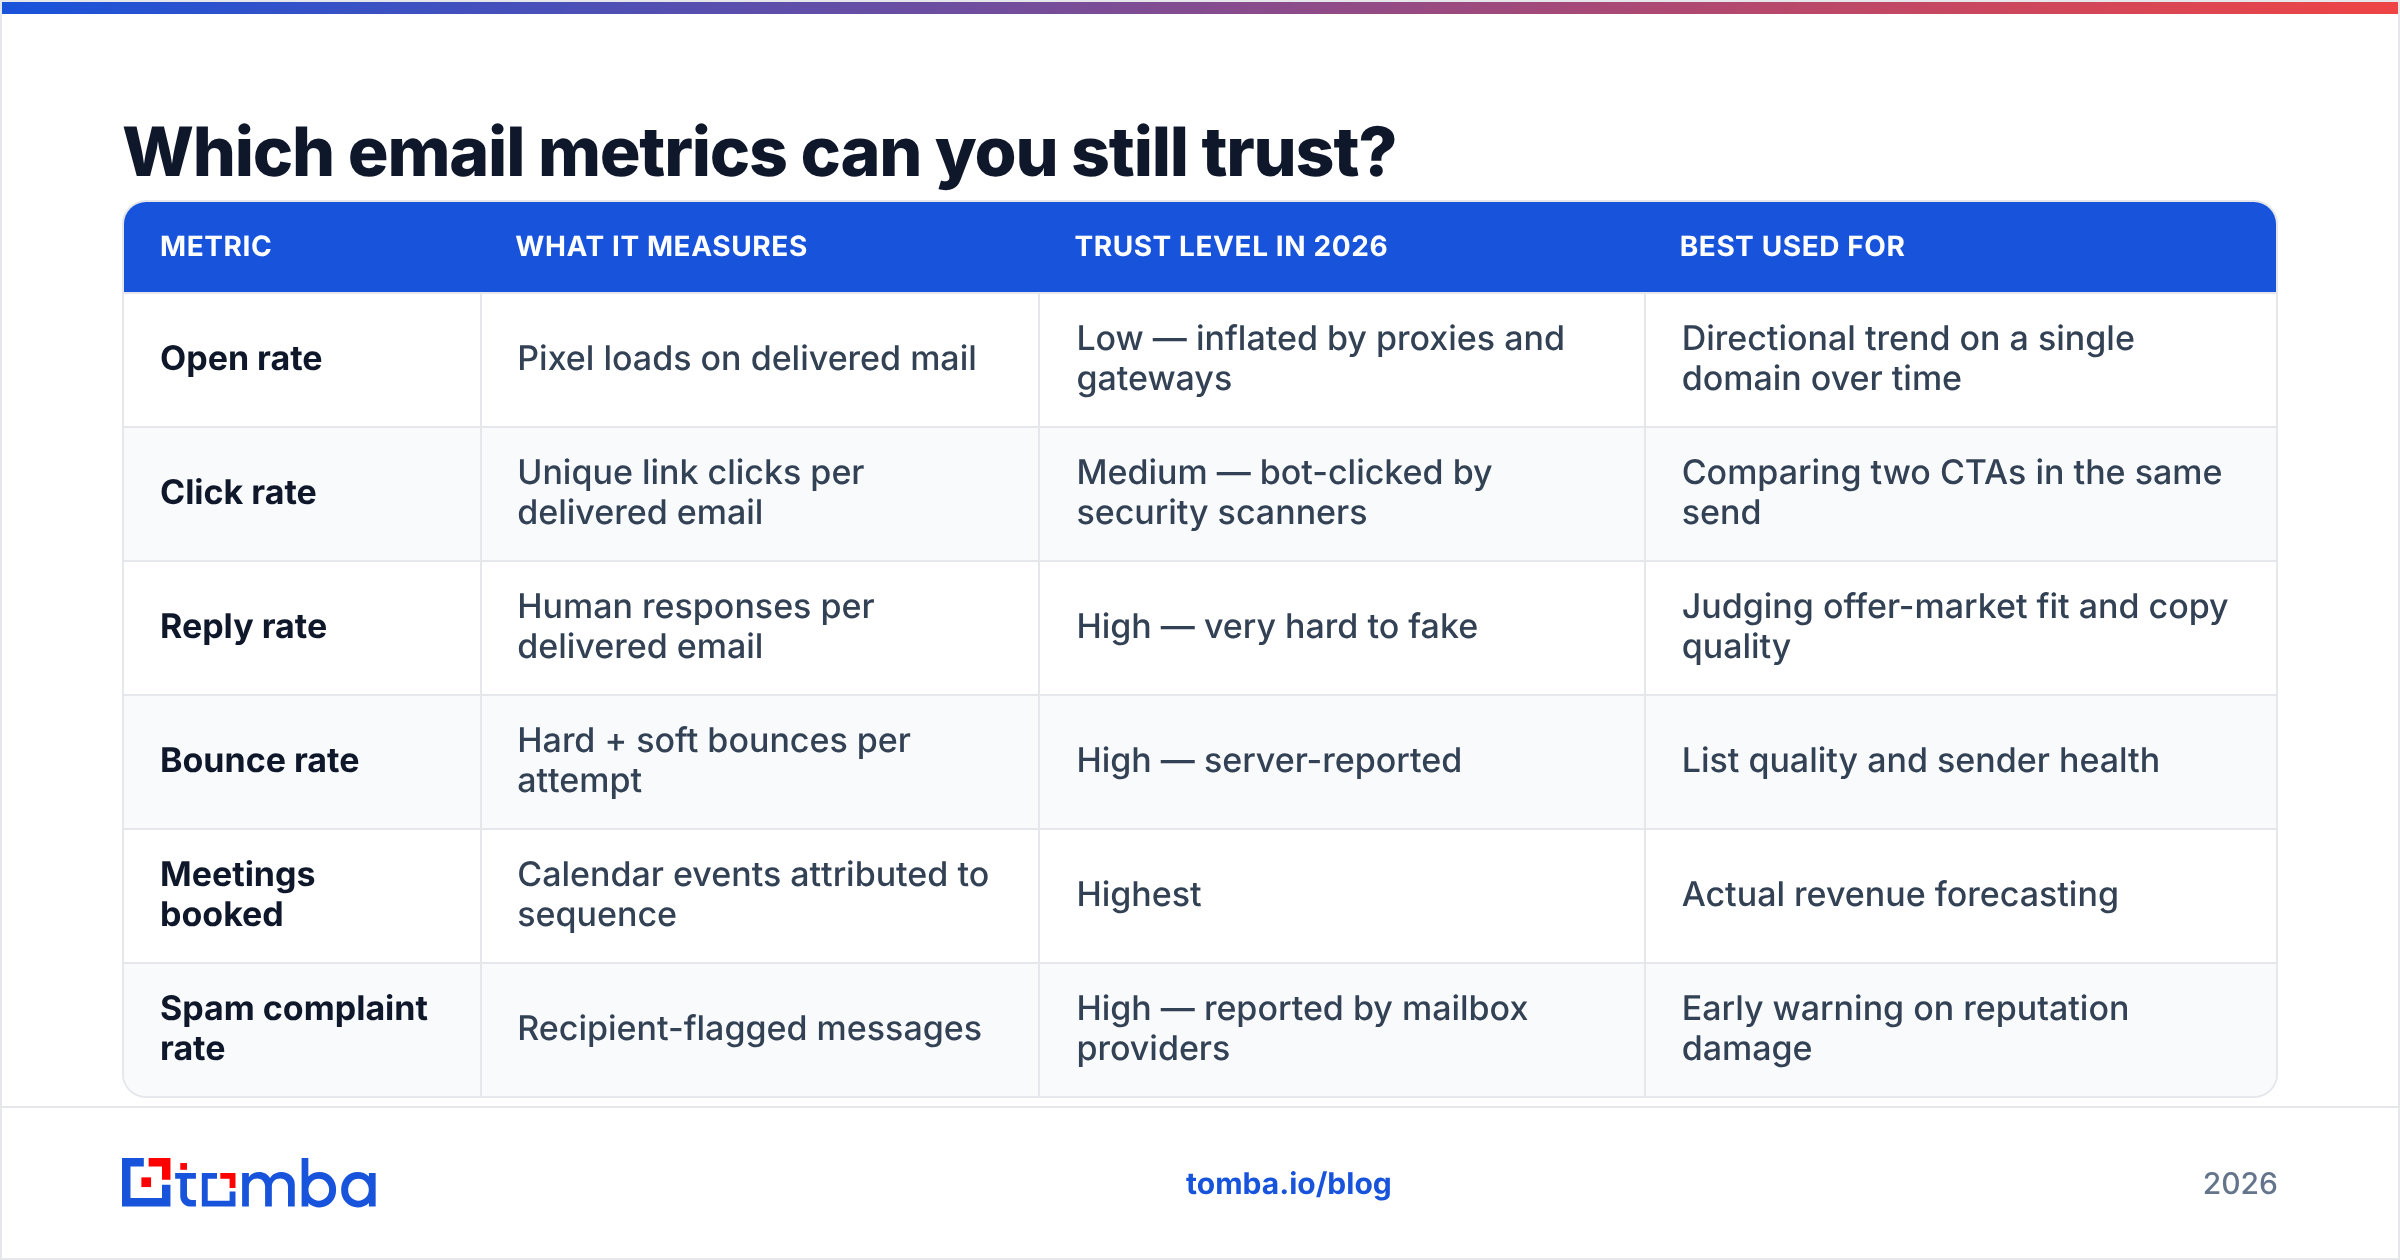
The table below shows commonly reported 2025-2026 ranges, split by send type. The "estimated human opens" column applies a conservative deflator based on the proportion of B2B inboxes served by Apple Mail and enterprise security gateways.
| Industry | Marketing email (reported) | Cold outbound (reported) | Estimated human opens | Typical reply rate |
|---|---|---|---|---|
| SaaS / software | 35-44% | 22-34% | 12-19% | 3-7% |
| Financial services | 30-38% | 15-24% | 9-14% | 1-3% |
| Healthcare / medtech | 33-41% | 14-22% | 8-13% | 1-3% |
| Manufacturing / industrial | 28-36% | 25-38% | 13-21% | 4-9% |
| Professional services | 32-40% | 20-30% | 11-17% | 2-5% |
| Recruiting / staffing | 36-45% | 28-42% | 15-23% | 5-11% |
| E-commerce / retail (B2B side) | 30-39% | 16-26% | 9-15% | 2-4% |
Two patterns are worth naming.
First, industries with lower digital maturity often show higher cold open rates. Manufacturing and industrial buyers get less outbound volume, so an unfamiliar sender is less likely to be pattern-matched as spam. SaaS founders receive 40+ pitches a week; their inbox is a warzone.
Second, marketing email and cold outbound behave differently and should never be compared on the same axis. A double opt-in newsletter list is talking to people who asked. Cold outbound is talking to people who did not. Aggregated benchmark reports from platforms like Mailchimp's email marketing benchmarks are dominated by opt-in sends, which is why their headline numbers look unreachable to an SDR team. HubSpot's marketing statistics hub has the same skew. Read both, but discount them for your context.
Why is your open rate falling even though your copy improved?#
Because open rate is downstream of five things, and copy is the fourth or fifth most important of them.
- Deliverability and inbox placement. If 30% of your sends land in spam, your ceiling is 70% before anyone reads a word. Placement is governed by authentication, domain age, send volume ramp, and complaint history — not by your subject line. Check your SPF record and DMARC alignment before you touch copy.
- List quality. Every invalid address is a bounce, and bounces are the single fastest way to torch sender reputation. Mailbox providers read a 6% bounce rate as "this sender scraped a list."
- Targeting relevance. The right person opens because the sender name and the first four words are relevant to their job this quarter. The wrong person does not open no matter how clever you are.
- Sender name and domain familiarity. A recognizable company domain outperforms a lookalike domain by a wide margin. Subdomain reputation is inherited slowly.
- Subject line and preview text. Real, but marginal — a good subject line moves open rate a few points on a healthy list and zero points on a dead one.
Teams reliably invert this order. They A/B test subject lines for six weeks while 22% of their list is undeliverable. Fix the base of the stack first.

How does list quality change your open rate math?#
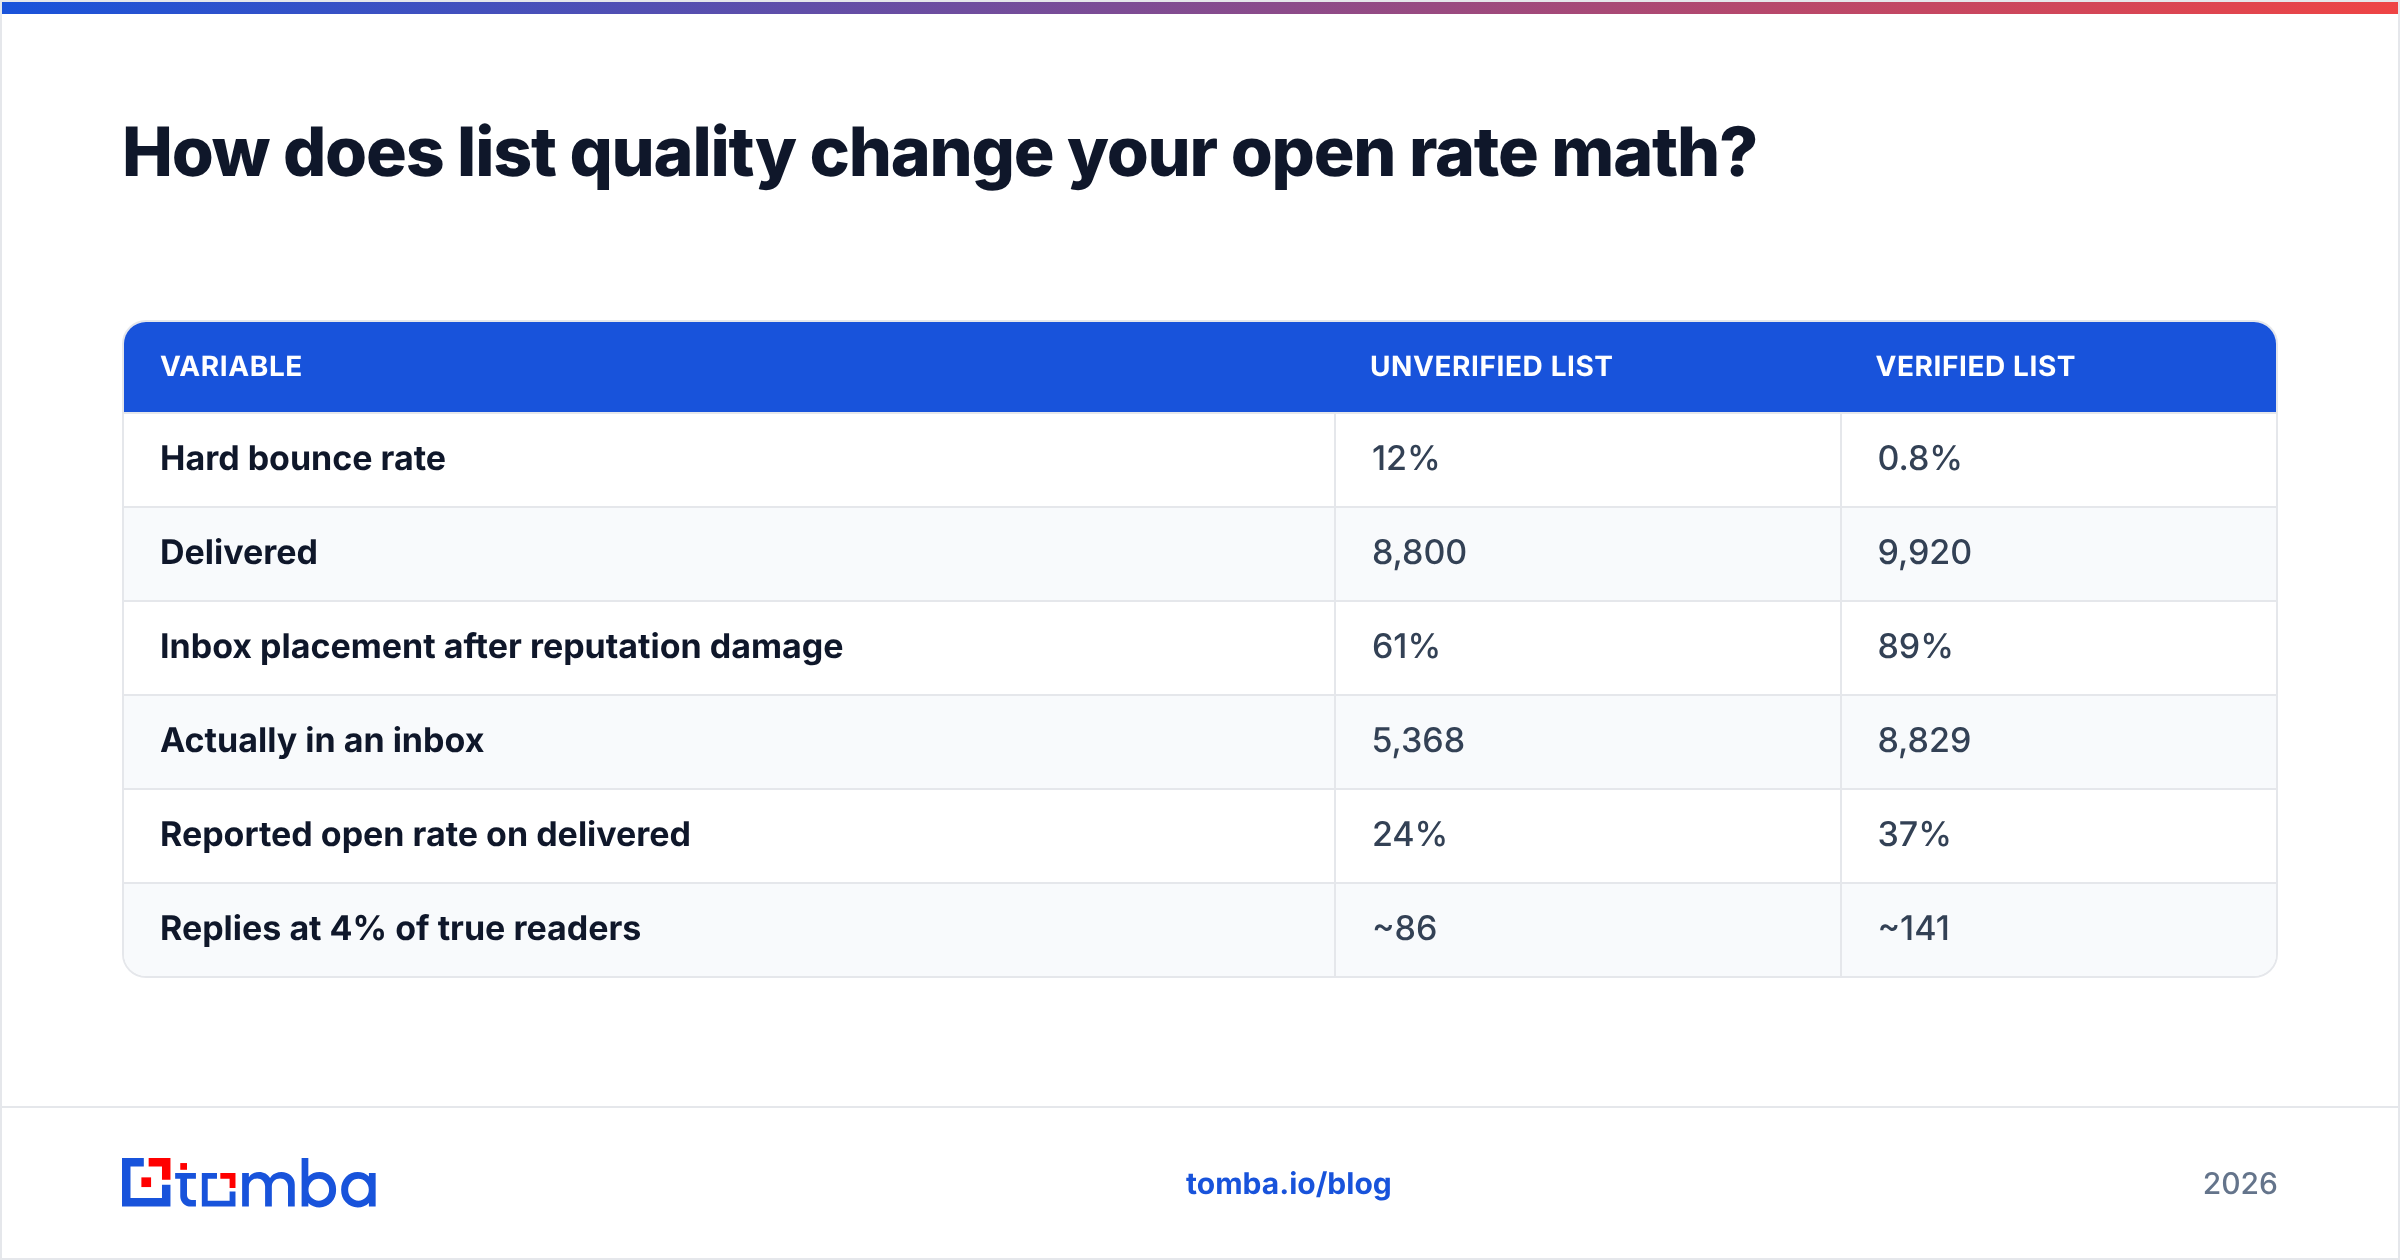
Consider two identical 10,000-contact campaigns with the same copy and the same sending infrastructure.
| Variable | Unverified list | Verified list |
|---|---|---|
| Hard bounce rate | 12% | 0.8% |
| Delivered | 8,800 | 9,920 |
| Inbox placement after reputation damage | 61% | 89% |
| Actually in an inbox | 5,368 | 8,829 |
| Reported open rate on delivered | 24% | 37% |
| Replies at 4% of true readers | ~86 | ~141 |
Same email. Same sender. Same offer. The verified list produces roughly 64% more replies, and the reported open rate jumps 13 points — not because anything about the message improved, but because the denominator stopped being contaminated and the reputation penalty never happened.
This is why an email verifier belongs in the pipeline before every send rather than once a quarter. B2B contact data decays at roughly 2-2.5% per month through job changes, domain migrations, and role eliminations. A list you verified in January is meaningfully wrong by June.
Catch-all domains are the second trap. Many enterprise mail servers accept everything at the SMTP layer and silently discard invalid addresses afterward, so a naive verifier marks them "valid." Running those through a catch-all verifier separates genuinely reachable mailboxes from black holes that quietly eat 8% of your send.
Should you stop tracking open rate entirely?#
No — you should demote it. Keep it, but change what you use it for.
Track open rate as a per-domain health signal, not a campaign KPI. Chart it daily for each sending domain and inbox. A sudden 40% relative drop across all campaigns on one domain is one of the earliest available warnings that placement has degraded, usually 24-72 hours before your reply rate tells you the same thing. That is genuinely valuable.
Stop using it as a campaign quality signal. Two campaigns cannot be compared by open rate when their audiences have different Apple Mail penetration. A campaign to design agencies (heavy Mac usage) will show inflated opens against a campaign to logistics companies (heavy Outlook desktop) with no difference in human behavior whatsoever.
Stop putting it in the board deck as a headline number. Replace it with replies per 1,000 sends and meetings per 1,000 sends. Those survive tracking-pixel decay entirely.
Some teams have gone further and disabled open tracking altogether. There is a real argument for it: tracking pixels are a mild spam signal, they add an image load to a plain-text-looking email, and privacy-conscious recipients notice. If your entire operation runs on reply rate, removing the pixel costs you nothing and marginally helps placement.
What actually moves the number that matters?#
Reply rate is the metric worth optimizing. Five interventions, ranked by observed impact per hour of effort:
- Verify before every send, not quarterly. Bounces below 2% keep you out of the reputation penalty box. This is the highest-leverage single change most teams can make and it takes an afternoon to automate through an email verification API.
- Cut list size, raise fit. 400 well-qualified contacts outperform 4,000 loosely-matched ones on replies and on deliverability, because engagement rate is itself a placement input. Mailbox providers watch whether people interact with your mail.
- Write a first line that could only have been written to this person. Not "I saw you're in SaaS." Something specific enough that a competitor could not paste it into their own template. This is where AI-generated personalization mostly fails — it produces plausible sentences that read as generated.
- Shorten to under 90 words. Long cold emails do not get read on mobile, and roughly 60% of first opens happen on a phone. Every sentence past the ask reduces reply probability.
- Send from a warmed, separate domain. Never run outbound from your primary corporate domain. A reputation incident on
yourcompany.combreaks invoicing, support, and recruiting email simultaneously. Useyourcompany-mail.comor similar, warmed over 4-6 weeks.
Before a big send, run the message through a spam checker and test the subject line with a subject line tester. Both take two minutes and occasionally catch a spam-trigger phrase or a truncation problem you would not have seen.
How should you build your own benchmark?#
External benchmarks are orientation, not a target. Your internal baseline is the only number you can act on.
Build it this way:
- Segment by send type. Newsletter, nurture, cold outbound, and transactional each get their own baseline. Never blend them.
- Segment by sending identity. Every domain and every mailbox gets its own trend line. Aggregates hide the one inbox that is on fire.
- Use a rolling 90-day median, not a mean. One viral send or one bot-farm campaign distorts an average badly. The median is robust.
- Record the denominator explicitly. Open rate on sent versus on delivered differs by your bounce rate. Most vendors report on delivered. Make sure you know which one your dashboard uses before comparing to anything external.
- Log the audience composition. Note the approximate share of Apple Mail and enterprise-gateway recipients. When your open rate shifts, you want to know whether the audience mix changed before you blame the copy.
After one quarter you will have something more useful than any industry report: a stable internal number with known measurement error, against which real changes are visible.
What is the honest summary?#
Open rate is a weakened metric that still has one good job — catching deliverability failures early on your own infrastructure. It has stopped being a valid comparison tool between companies, campaigns, or industries, and the published benchmark tables are mostly measuring how many of a given audience use Apple Mail.
Optimize the inputs that survive measurement decay: a verified list, tight targeting, a warmed dedicated domain, short specific copy, and reply rate as the scoreboard. Teams that do this consistently report 3-9% reply rates in B2B outbound, which is a far more defensible number than a 45% open rate that nobody can audit.
Start where the leverage is highest. If your bounce rate is above 3%, no amount of copy work will help until the list is clean — find accurate, verified contacts at your target accounts with the Tomba Email Finder, run them through verification before the first send, and check Tomba pricing to size a plan against your monthly send volume. The free tier covers 25 searches a month if you want to test accuracy on your own accounts before committing.
Related guides#
Ready to find emails that actually work?
Join 150,000+ professionals who stopped guessing and started sending. Free credits on signup — no credit card required.
Get the Tomba newsletter
Practical outbound tactics and product updates — once every two weeks.
About the author