Email Response Rate: How to Measure and Improve It in 2026
Most teams track open rates and wonder why pipeline is flat. Here's how to calculate email response rate correctly, what a good benchmark actually looks like in 2026, and the five levers that move it.
TL;DR
- Email response rate = (unique replies ÷ delivered emails) × 100. Use delivered, not sent, and count unique human replies once — not per-thread.
- A healthy cold outbound response rate in 2026 sits between 3% and 8%. Anything above 10% usually means a very tight list, a warm signal, or a small sample.
- Open rate is no longer a reliable input. Apple Mail Privacy Protection and Gmail image proxying inflate it, so reply rate is now the first honest metric in the funnel.
- The biggest single lever is list quality, not copy. Bad data caps your ceiling before a word gets read — a 12% bounce rate mathematically destroys your reply math and your sender reputation at the same time.
- Fix the sequence in this order: deliverability → targeting → relevance → offer → follow-up. Rewriting subject lines first is the most common wasted week in outbound.
What is email response rate, exactly?#
Email response rate is the percentage of delivered emails that receive at least one reply from a unique recipient.
Think of it like a restaurant handing out flyers on a street corner. "Flyers printed" is your send volume. "Flyers actually handed to a person" is delivered. "People who walked in the door" is your response. Only the last number pays rent — and most teams obsess over the first two.
The formula:
Response Rate = (Unique Replies ÷ Delivered Emails) × 100Three rules that separate a real number from a vanity number:
- Use delivered, not sent. If you send 1,000 and 120 bounce, your denominator is 880. Using 1,000 quietly understates your performance and hides a data-quality problem.
- Count unique recipients, not messages. If one prospect replies four times in a thread, that's one response.
- Filter auto-replies. Out-of-office bounces, ticket-system confirmations, and "I've left the company" autoresponders are not responses. Most sequencers now tag these, but the defaults are imperfect — audit a sample of 50 replies manually once a quarter.
You'll also see positive reply rate, which is the subset of responses that express interest. That's the metric your CRO actually cares about. A 9% response rate where 80% of replies are "unsubscribe" is worse than a 4% rate where half book a call.
What is a good email response rate in 2026?#
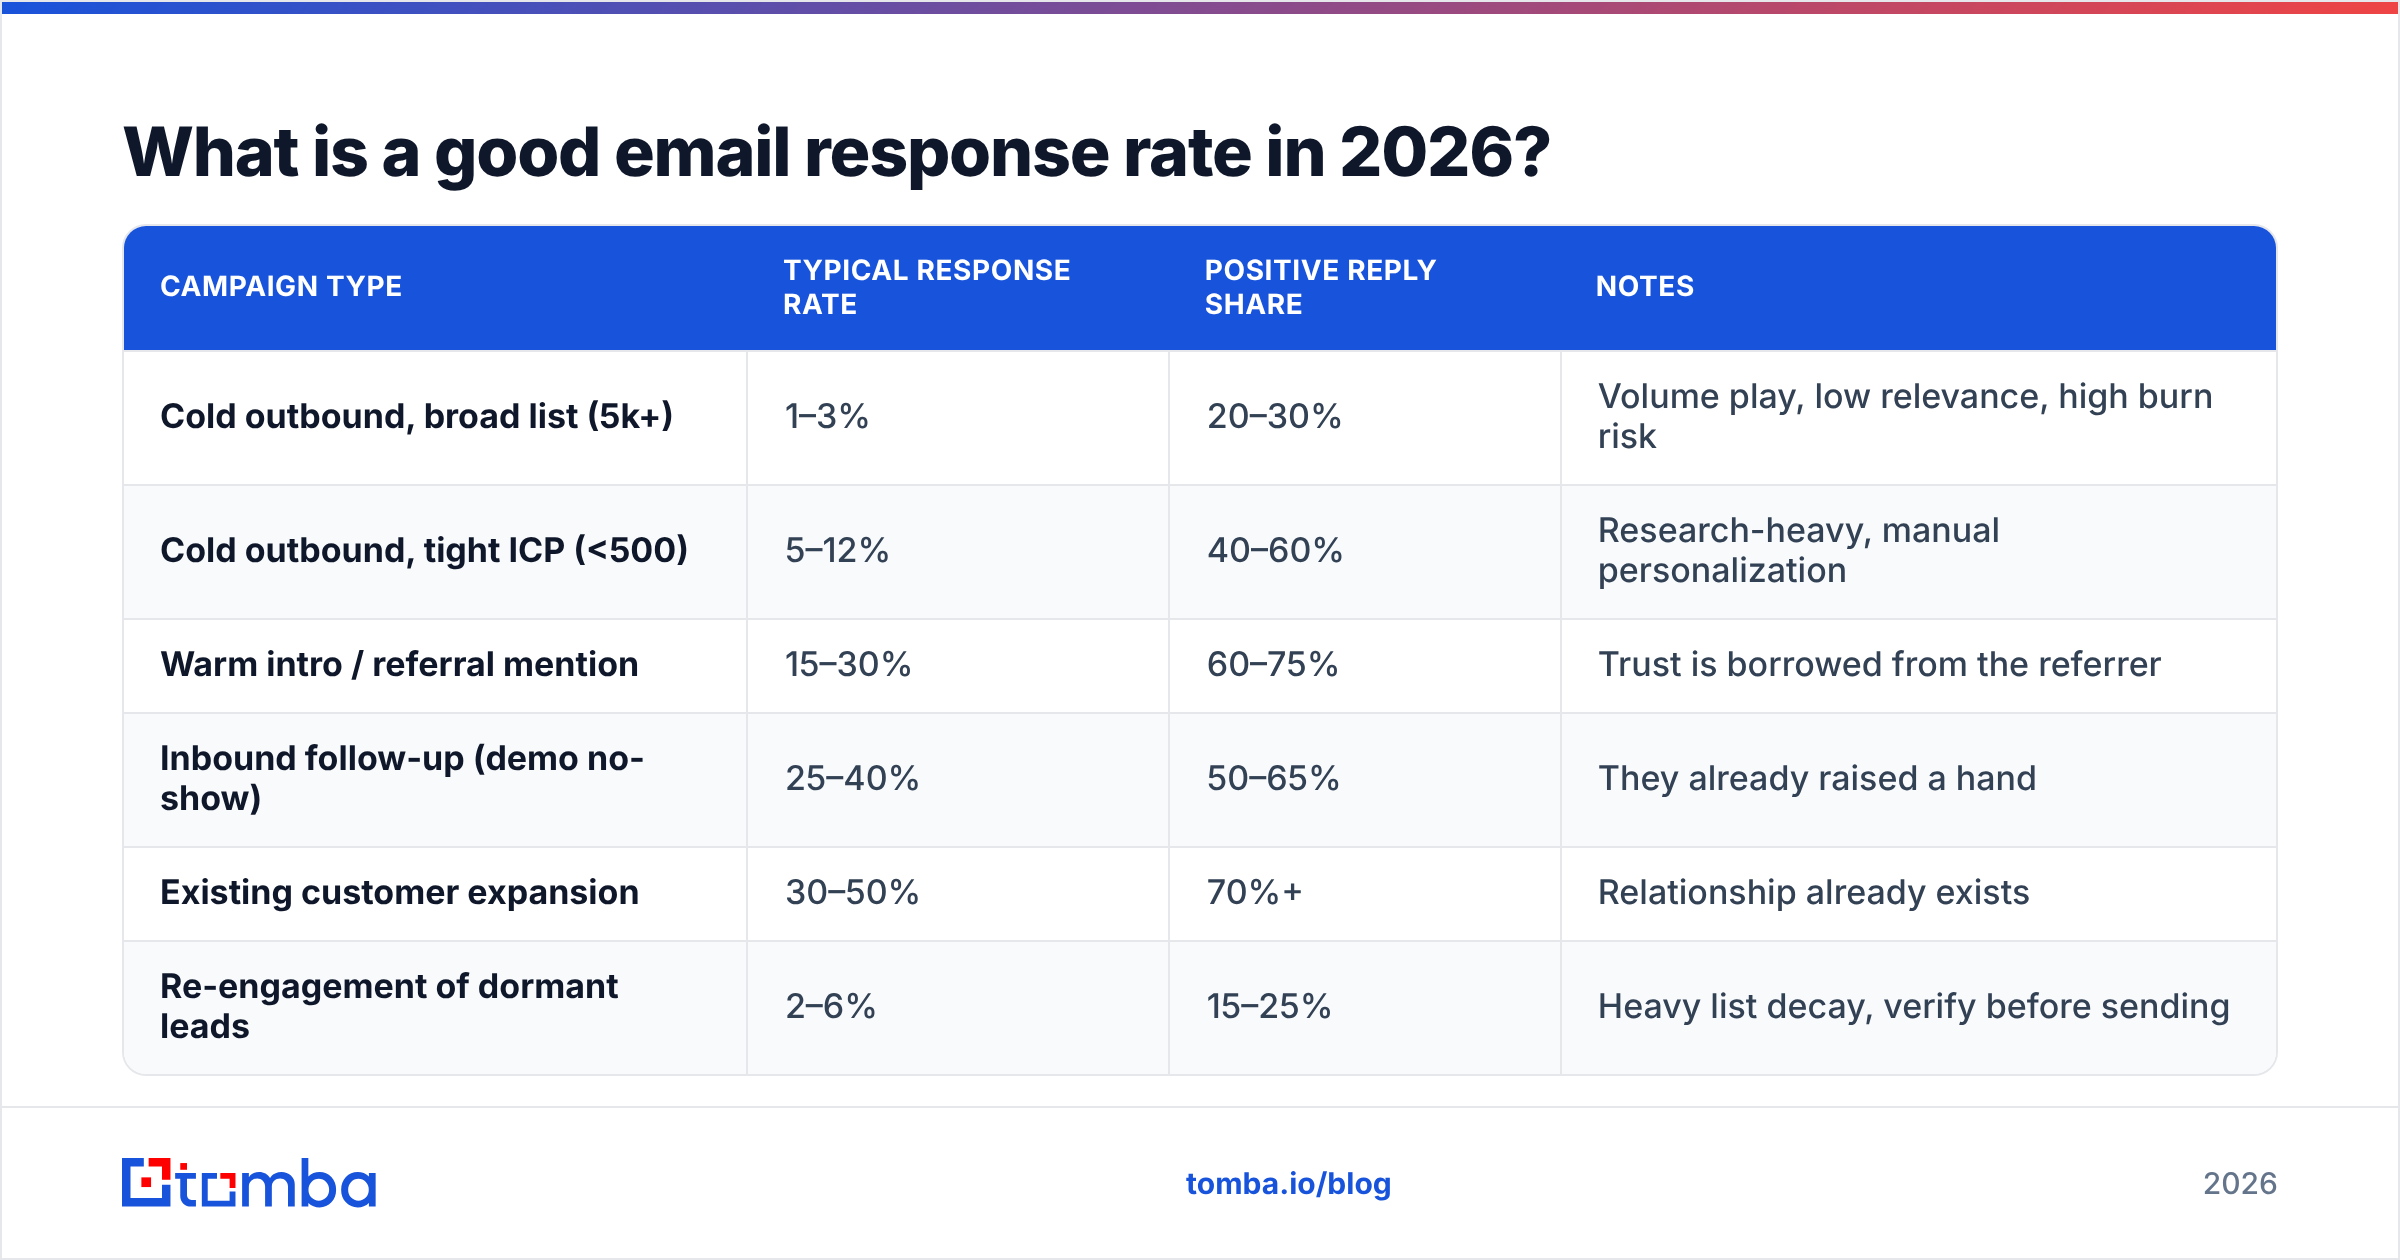
It depends almost entirely on how warm the contact is and how large your list is. Here's what holds up across the campaigns we see reported publicly and privately.
| Campaign type | Typical response rate | Positive reply share | Notes |
|---|---|---|---|
| Cold outbound, broad list (5k+) | 1–3% | 20–30% | Volume play, low relevance, high burn risk |
| Cold outbound, tight ICP (<500) | 5–12% | 40–60% | Research-heavy, manual personalization |
| Warm intro / referral mention | 15–30% | 60–75% | Trust is borrowed from the referrer |
| Inbound follow-up (demo no-show) | 25–40% | 50–65% | They already raised a hand |
| Existing customer expansion | 30–50% | 70%+ | Relationship already exists |
| Re-engagement of dormant leads | 2–6% | 15–25% | Heavy list decay, verify before sending |
Two things to notice. First, the spread between the top and bottom row is more than 20x — which tells you list selection matters more than any copy trick. Second, positive reply share moves in the same direction as raw response rate. Better targeting doesn't just get more replies, it gets better replies.
If you want a single number to hold yourself to: 5% response rate with a 40% positive share on cold outbound is a genuinely good campaign in 2026. Below 2%, something structural is broken.

Why has open rate stopped being useful?#
Because it's been measured by a pixel that no longer loads honestly.
Apple's Mail Privacy Protection, rolled out in iOS 15 and now the default behavior for a large share of consumer and mixed-use inboxes, pre-fetches tracking pixels whether or not a human opens the message. Gmail proxies images through Google's servers. Corporate security gateways open every link and image in a sandbox before delivery. The result: opens get logged for emails nobody read, and some genuine reads never register at all.
The practical consequences:
- Open rates inflate by 15–40% depending on your audience's device mix. B2B lists skewing toward Apple devices inflate the most.
- Link-click tracking is contaminated too. Security scanners click every URL in your email. If you see clicks within two seconds of delivery from a datacenter IP, that's a bot.
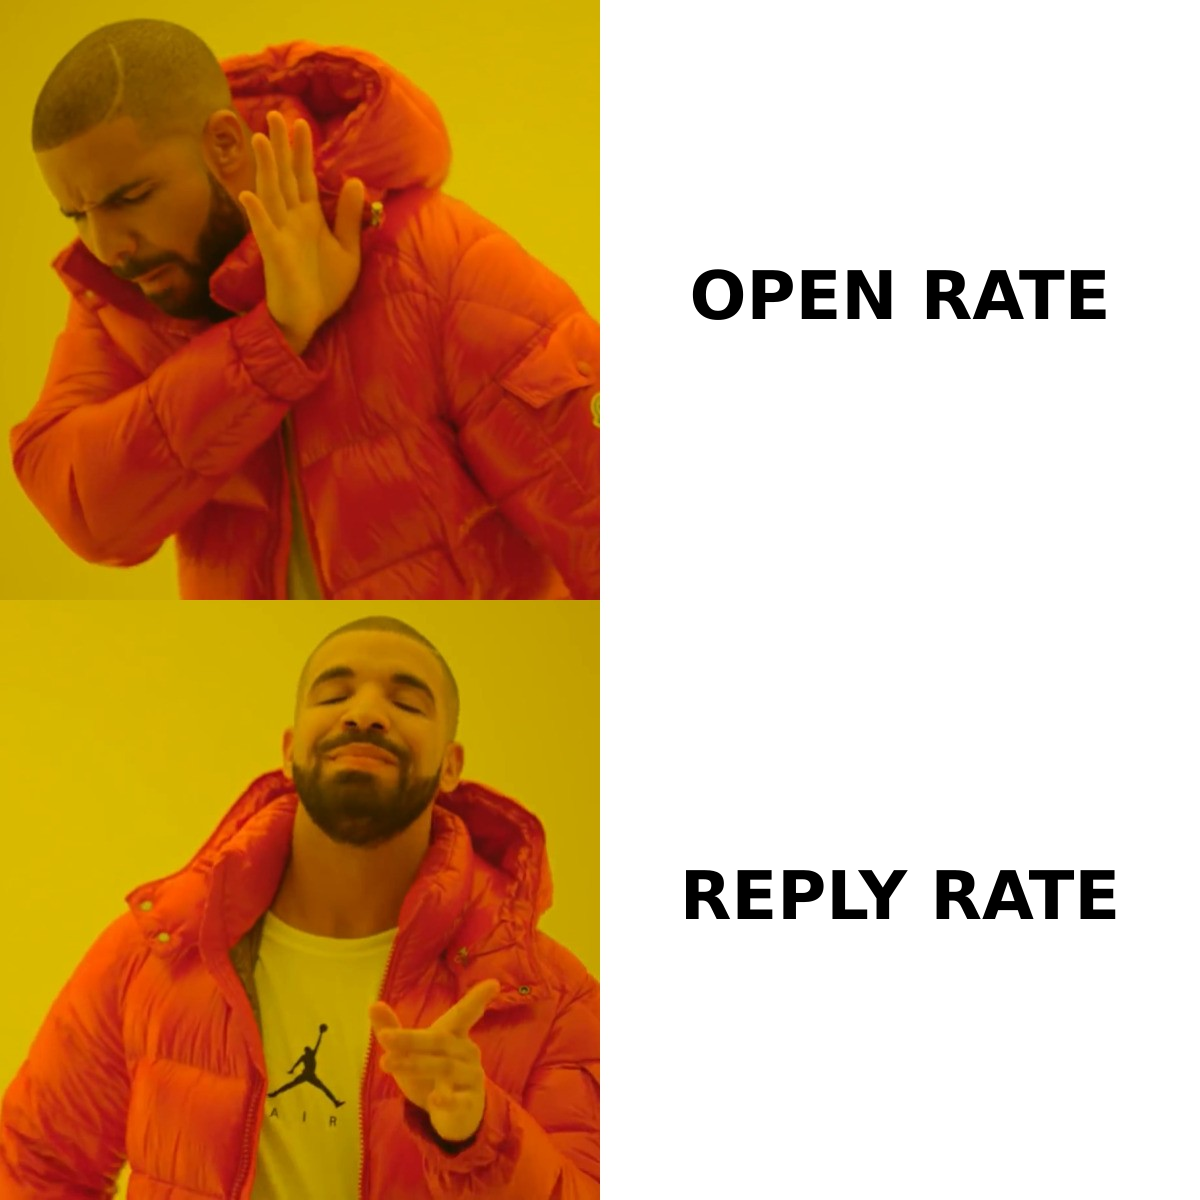
- A/B tests on subject lines using open rate as the success metric are now largely noise. Test on reply rate, which requires bigger samples and more patience.
This is why the metric hierarchy has flipped. Deliverability tells you whether the message arrived. Reply rate tells you whether it worked. Everything in between is decorative.
How do you calculate response rate without fooling yourself?#
Run this audit on your last completed campaign. It takes twenty minutes and usually finds at least one broken assumption.
- Export raw sends, not dashboard summaries. Sequencers round, dedupe inconsistently, and sometimes count a thread reply on step 3 against step 1.
- Subtract hard bounces from the denominator. Soft bounces (full mailbox, temporary defer) are judgment calls — we'd include them as delivered attempts if the sequencer eventually got through.
- Deduplicate by contact, then by company. If you emailed three people at the same account and one replied, your account-level response rate is 100% and your contact-level rate is 33%. Both are useful; conflating them is not.
- Classify replies into four buckets: positive, neutral/defer ("not now, check back Q3"), negative, and auto. Report all four.
- Segment by list source. Scraped list vs. verified list vs. inbound signal — these will diverge dramatically, and the average across them is meaningless.
- Compare against the same segment last quarter, not against a blog benchmark. Your baseline is the only benchmark that controls for your ICP, offer, and sender domain.
That fifth step is where most teams find their problem. When you split a 3.1% blended response rate by source, you often find a verified segment at 7% and a scraped segment at 0.4% — and you've been diluting your sender reputation and your morale with the second one.
Does list quality really outweigh copy?#
Yes, and the math isn't close.
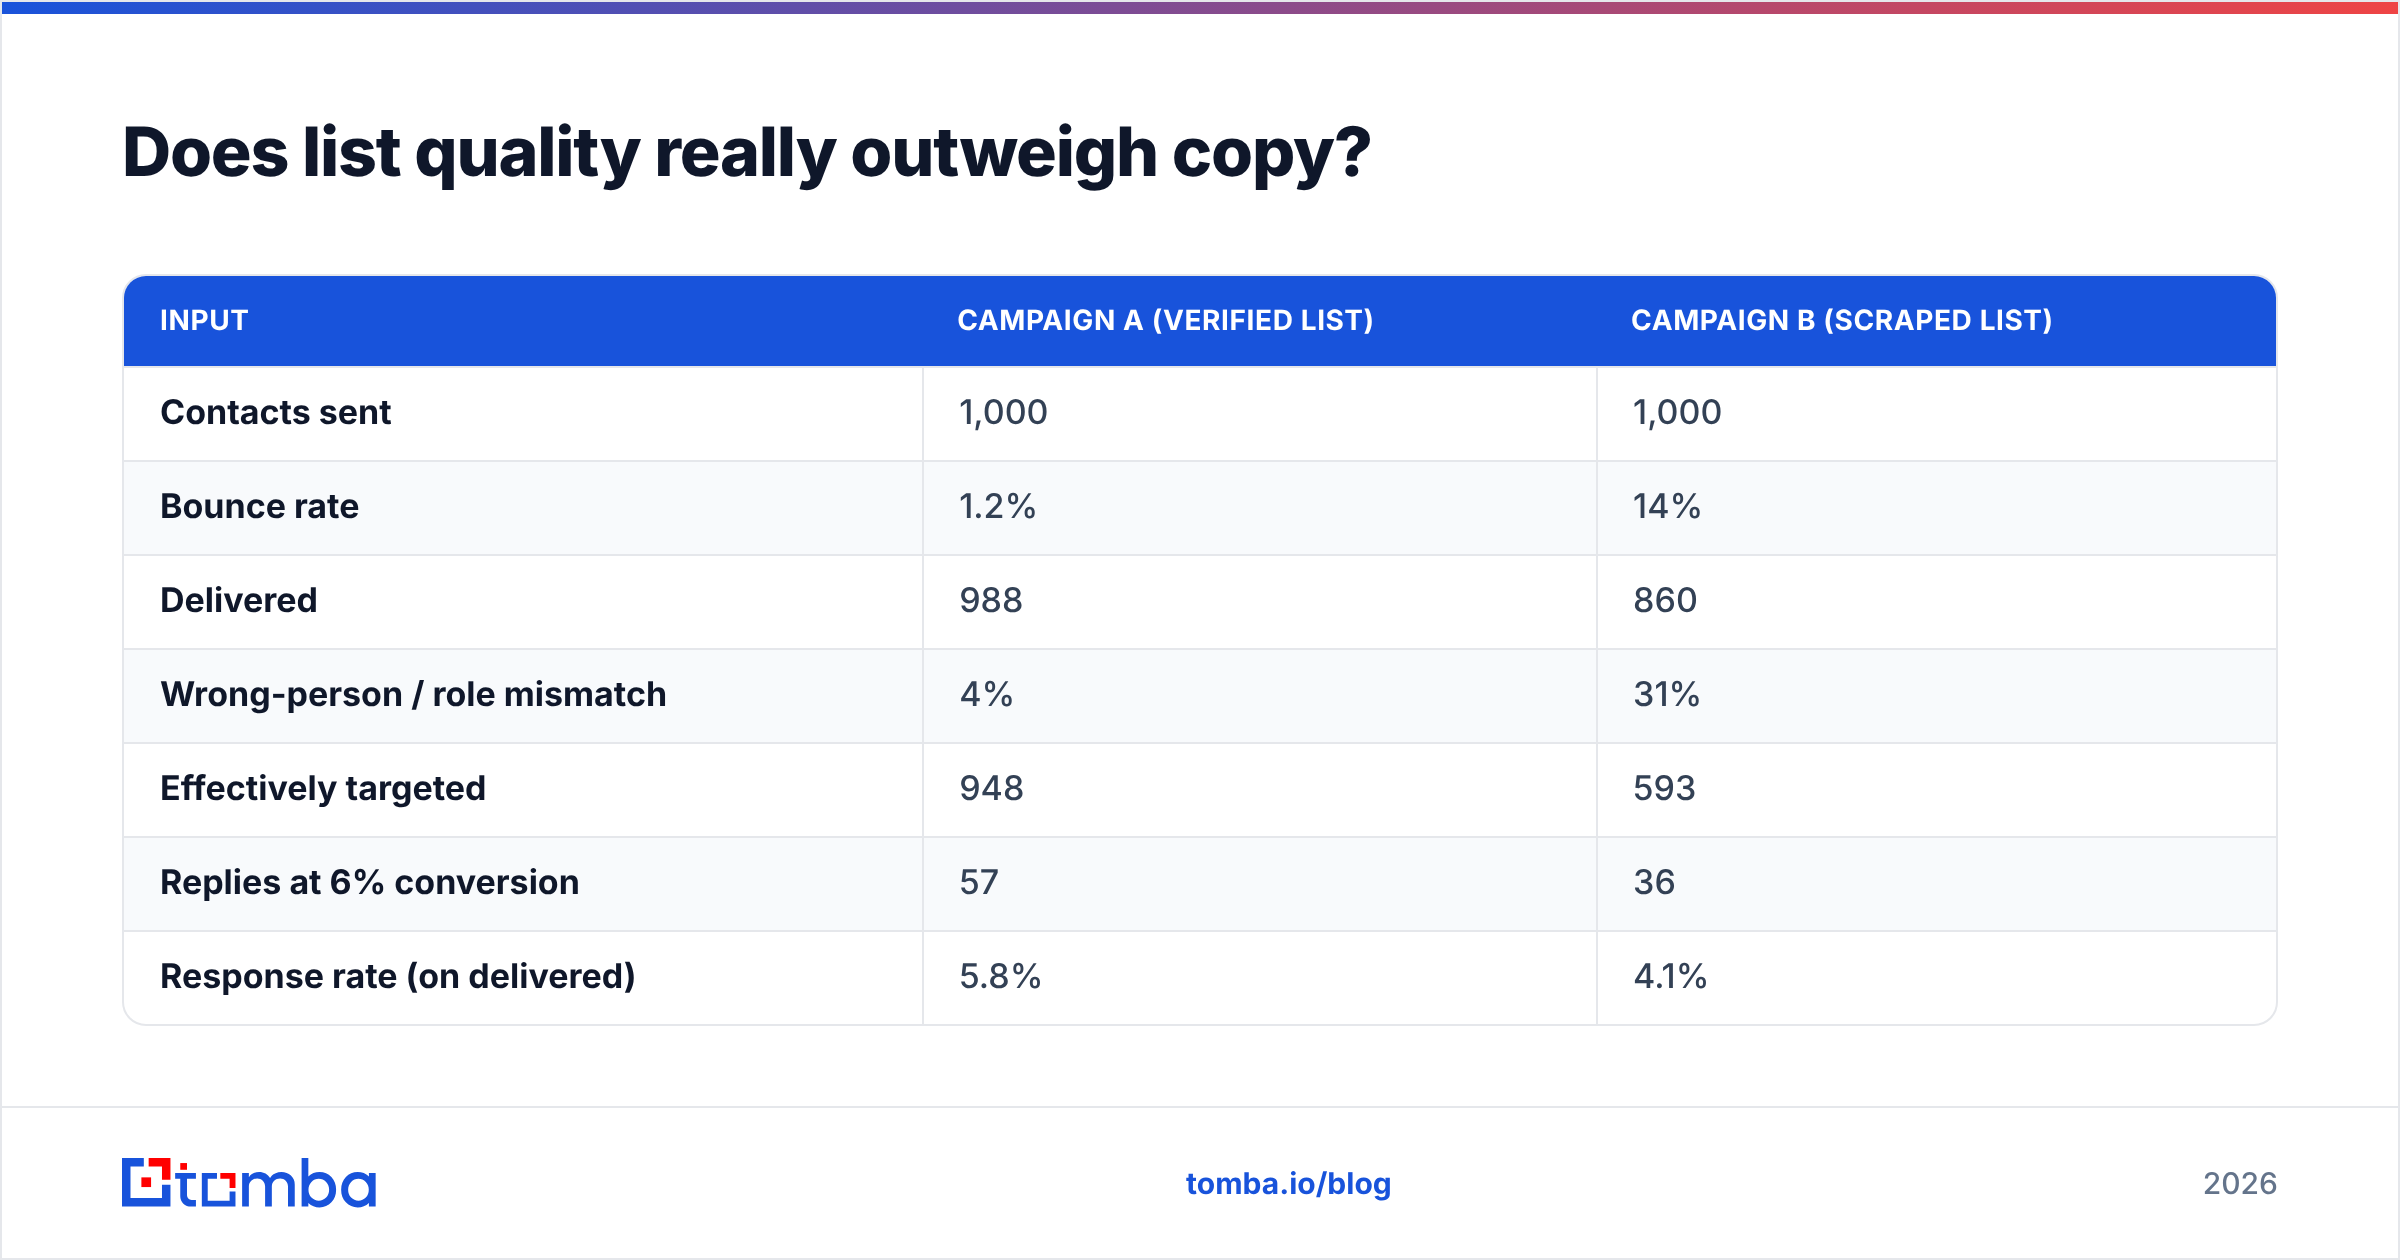
Consider two campaigns, both 1,000 contacts, both with identical copy that converts 6% of correctly targeted, deliverable recipients.
| Input | Campaign A (verified list) | Campaign B (scraped list) |
|---|---|---|
| Contacts sent | 1,000 | 1,000 |
| Bounce rate | 1.2% | 14% |
| Delivered | 988 | 860 |
| Wrong-person / role mismatch | 4% | 31% |
| Effectively targeted | 948 | 593 |
| Replies at 6% conversion | 57 | 36 |
| Response rate (on delivered) | 5.8% | 4.1% |
| Domain reputation impact | Neutral | Degraded |
Campaign B loses 37% of its replies before anyone reads the first line — and the 14% bounce rate is the bigger long-term cost. Mailbox providers read high bounce rates as a signal that you're sending to a purchased or stale list, and they throttle your domain accordingly. The next campaign starts from a worse position, which is how outbound programs enter a slow death spiral that gets blamed on "the market."
The fix is boring and it works: verify before you send. Run your list through an email verifier and drop anything that comes back invalid or risky. For domains that accept everything, a dedicated catch-all verifier gives you a probabilistic answer rather than a shrug. If you're building the list from scratch, sourcing through domain search against a target account list is far cleaner than exporting whatever a scraper found.
Google's own sender guidelines put a hard number on this: keep spam complaint rates below 0.3% and authenticate with SPF, DKIM, and DMARC. Bounce rate isn't in their published threshold, but it feeds directly into the reputation model that decides whether you land in the primary tab.
Which levers actually move email response rate?#
In order of impact, measured by how much lift you get per hour of work:
1. Deliverability foundations. SPF, DKIM, and DMARC configured. Dedicated sending domain, not your primary. Warmed for at least three weeks before volume. Under 50 sends per mailbox per day. This isn't optimization — it's the price of entry. Run your domain through an SPF checker and confirm the record resolves cleanly.
2. Targeting precision. The single highest-leverage question: would this person's boss agree they own this problem? If the answer is uncertain, your response rate is capped around 2% no matter what you write. Cut list size by 70% and quality goes up more than proportionally.
3. Relevance signal in the first two lines. Not "I saw you went to Michigan" — that's personalization theater and prospects have learned to skim past it. Real relevance references something about their business situation: a hiring pattern, a product launch, a stack change, a specific line in their earnings call.
4. A low-friction ask. "Worth a 15-minute call next Tuesday?" converts worse than "Is this something your team owns, or should I be talking to someone else?" The second is easier to answer, and a routing reply is still a reply — often a better one, because it comes with a warm internal handoff.
5. Follow-up discipline. Roughly half of all replies in a well-built sequence arrive on messages 2 through 4. Teams that stop at one email are leaving most of their response rate on the table. But each follow-up should add new information, not just "bumping this to the top of your inbox."
How do tools compare for improving response rate?#
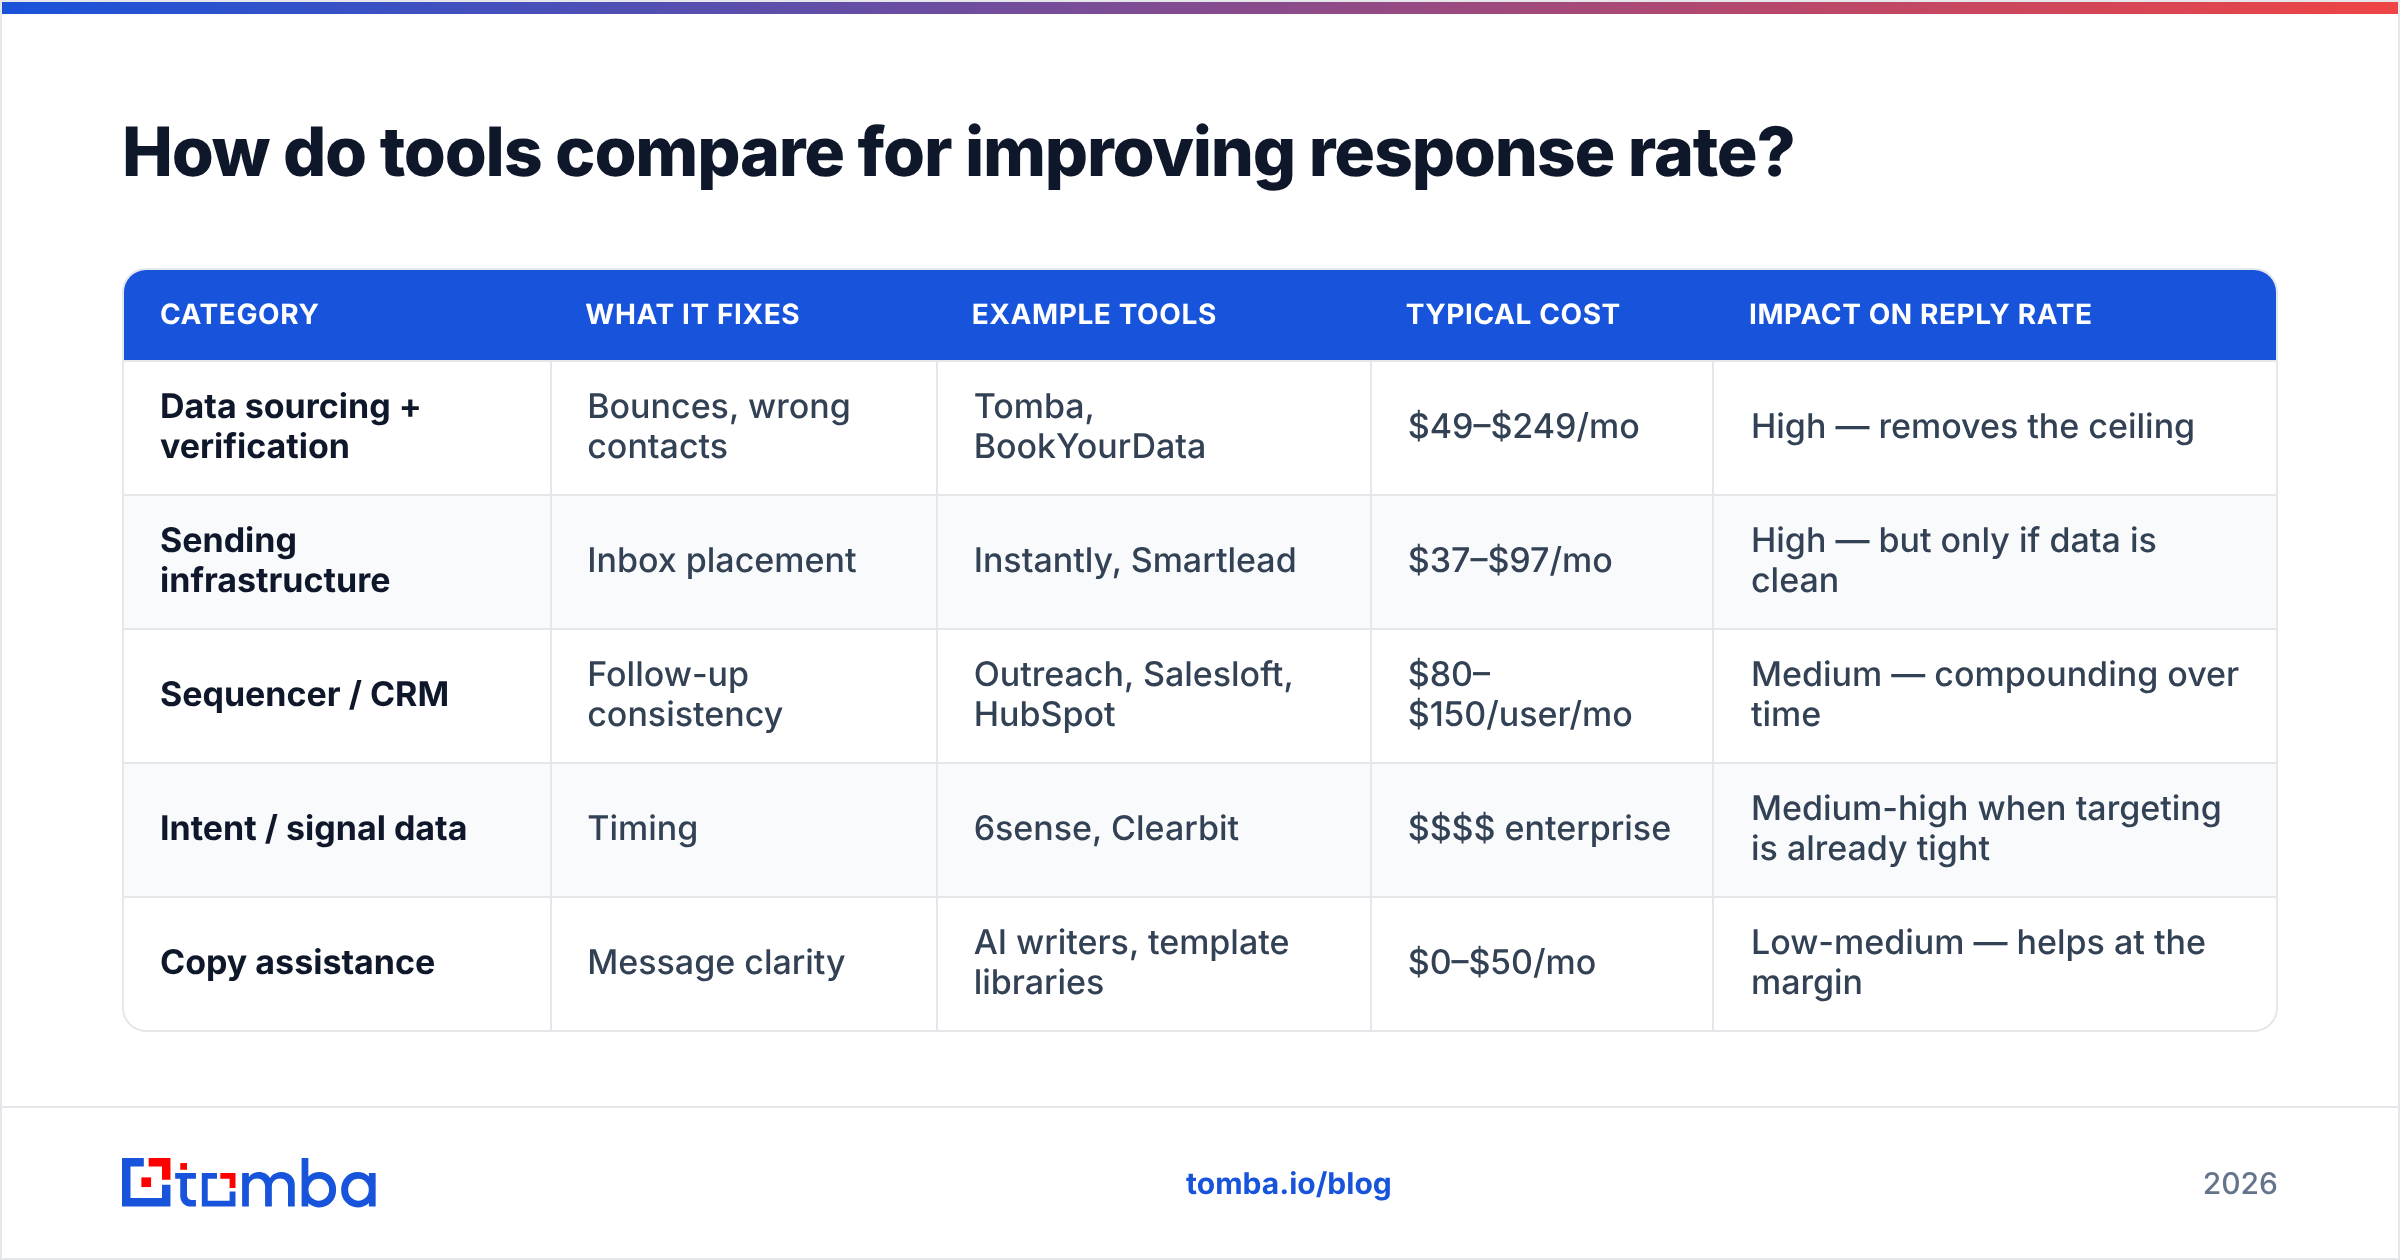
Different categories attack different parts of the problem. Confusing them is expensive — buying a sequencer when your data is the bottleneck just automates your bad list faster.
| Category | What it fixes | Example tools | Typical cost | Impact on reply rate |
|---|---|---|---|---|
| Data sourcing + verification | Bounces, wrong contacts | Tomba, BookYourData | $49–$249/mo | High — removes the ceiling |
| Sending infrastructure | Inbox placement | Instantly, Smartlead | $37–$97/mo | High — but only if data is clean |
| Sequencer / CRM | Follow-up consistency | Outreach, Salesloft, HubSpot | $80–$150/user/mo | Medium — compounding over time |
| Intent / signal data | Timing | 6sense, Clearbit | $$$$ enterprise | Medium-high when targeting is already tight |
| Copy assistance | Message clarity | AI writers, template libraries | $0–$50/mo | Low-medium — helps at the margin |
On the data side, Tomba pricing starts with a free tier at 25 searches per month, then $49/mo for Starter, $99/mo for Growth, and $249/mo for Pro. BookYourData takes a different route with pay-as-you-go credits and a 97% accuracy guarantee, which suits teams that buy lists in bursts rather than searching continuously. Both solve the "is this address real" problem; pick based on whether your workflow is search-driven or list-purchase-driven.
If you want an independent read on any of these, G2's sales intelligence category has enough review volume to smooth out the outliers.
What does a response-rate-optimized sequence look like?#
A four-touch structure that consistently outperforms the "5 emails in 5 days" pattern:
- Day 1 — the observation. Two sentences on a specific thing happening at their company, one sentence connecting it to a problem you solve, one question. Under 90 words. No links, no attachments, no calendar embed.
- Day 4 — the proof. A single concrete result from a comparable company, with a number. "Cut their bounce rate from 11% to 1.4% in six weeks." Then the same question, rephrased.
- Day 9 — the reframe. Assume your first angle was wrong. Offer a different problem you solve. This catches prospects who ignored you because you guessed the wrong pain, which is more common than being ignored for being irrelevant entirely.
- Day 16 — the permission close. "I'll stop here unless you tell me otherwise — should I close the file?" This one reliably pulls replies from people who've been meaning to respond. Just make sure you actually stop.
Notice what's missing: no "just checking in," no "did you see my last email," no fifth and sixth touch. Each message earns its place by carrying new information. If you can't write a follow-up that adds something, the sequence is over.
For inbound-adjacent plays, reverse email lookup is useful when you have an address from a form fill or a webinar list but no context on who the person actually is — enriching before you write beats guessing.
What should you measure alongside response rate?#
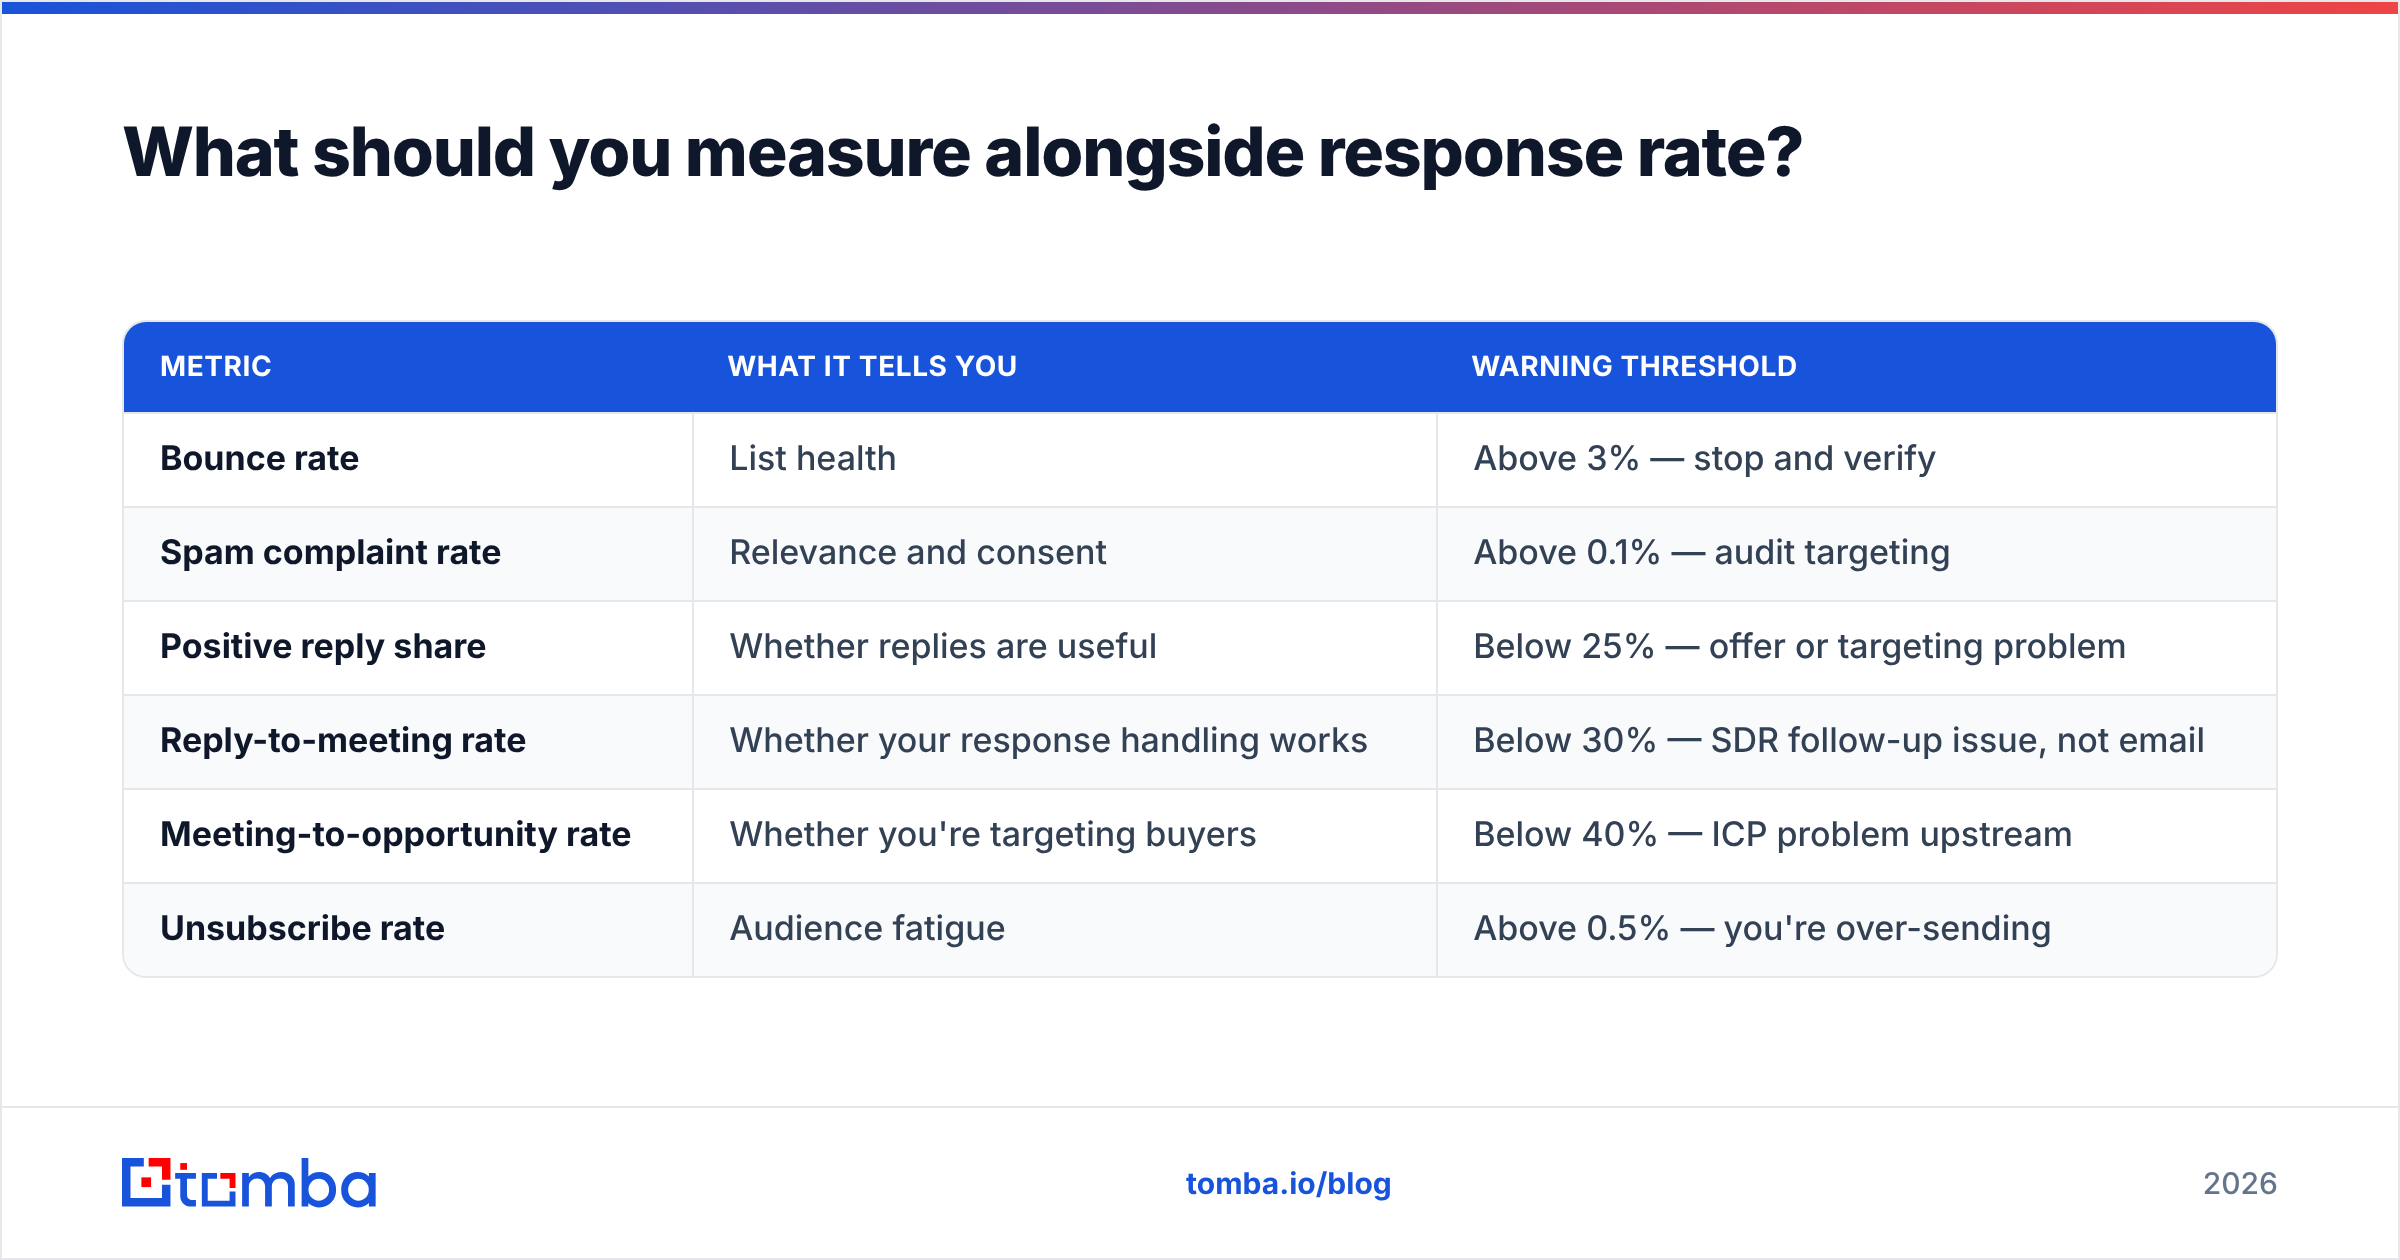
Response rate alone can be gamed. A provocative subject line and a confrontational opener will spike replies and tank your pipeline. Track these together:
| Metric | What it tells you | Warning threshold |
|---|---|---|
| Bounce rate | List health | Above 3% — stop and verify |
| Spam complaint rate | Relevance and consent | Above 0.1% — audit targeting |
| Positive reply share | Whether replies are useful | Below 25% — offer or targeting problem |
| Reply-to-meeting rate | Whether your response handling works | Below 30% — SDR follow-up issue, not email |
| Meeting-to-opportunity rate | Whether you're targeting buyers | Below 40% — ICP problem upstream |
| Unsubscribe rate | Audience fatigue | Above 0.5% — you're over-sending |
The pattern to watch for: rising response rate with falling reply-to-meeting rate. That means you're getting more replies but worse ones — usually a sign that your copy has drifted toward curiosity bait that doesn't survive the second message.
Common mistakes that quietly cap your response rate#
- Measuring against sent instead of delivered. Makes a data problem look like a copy problem.
- Sending to catch-all domains without verification. They don't bounce, so they look fine in your dashboard while going nowhere.
- Running the same sequence across wildly different segments. A 12-person startup and a 4,000-person enterprise don't share a pain statement.
- Optimizing subject lines using open rate. See the section above — that metric is contaminated.
- Testing two variables at once. New copy and a new list in the same test tells you nothing about either.
- Declaring a winner on 200 sends. At a 5% base rate you need roughly 1,500+ per variant to detect a meaningful difference. Most "our new template doubled replies" claims are sampling noise.
- Ignoring the reply handling loop. A 30-minute response time to an inbound reply converts dramatically better than a next-day response, and it costs nothing to fix.
Where should you start if your response rate is under 2%?#
Work in this order and don't skip ahead:
- Verify your list. Run everything through verification. If more than 8% comes back invalid, your data source is the problem and nothing downstream will help.
- Check your authentication. SPF, DKIM, DMARC. Then send a test to a seed list across Gmail, Outlook, and a corporate domain and confirm primary-tab placement.
- Cut your list by 70%. Keep only contacts where you can articulate, in one sentence, why this specific person cares this specific quarter.
- Rewrite the first two lines only. Everything else in the email matters less than whether the opener proves you did homework.
- Extend the sequence to four touches with distinct angles. Then measure again after a full cycle, not after three days.
Most teams find their number moves between step 1 and step 3 — before they've touched a single word of copy.
Start where the leverage is. If your bounce rate is above 3% or you can't confidently say every contact on your list holds the role you think they hold, your response rate problem is a data problem wearing a copy costume. The Tomba Email Finder finds verified professional addresses by domain, name, or company, with a free tier at 25 searches per month so you can test the difference on a single segment before committing. Verify one campaign's list, send it against your existing control, and compare reply rates after a full cycle. The gap is usually larger than anything a new subject line will buy you.
Related guides#
Ready to find emails that actually work?
Join 150,000+ professionals who stopped guessing and started sending. Free credits on signup — no credit card required.
Get the Tomba newsletter
Practical outbound tactics and product updates — once every two weeks.
About the author