Enterprise Sales Metrics: The 14 KPIs That Actually Matter
Most enterprise sales dashboards track 40 numbers and predict nothing. This guide cuts the list to the 14 enterprise sales metrics that actually move forecast accuracy, win rates, and net revenue retention.
TL;DR
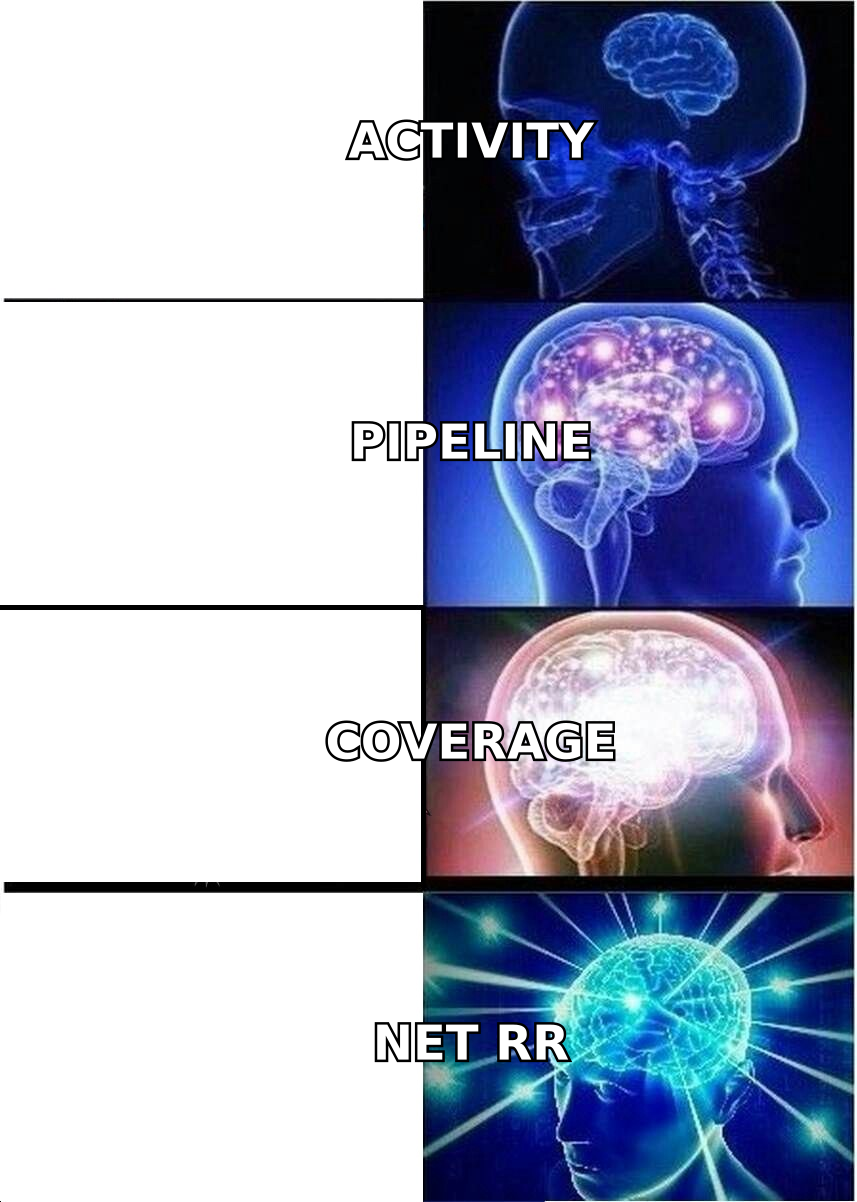
- Enterprise sales metrics fall into four layers: activity, pipeline, conversion, and revenue quality. Most teams over-instrument the first layer and under-instrument the last two.
- Fourteen KPIs cover almost every enterprise sales review. Anything beyond that is usually a diagnostic, not a metric you manage to.
- Forecast accuracy is the single hardest metric to fake and the one boards care most about — track it as a rolling variance, not a one-off percentage.
- Deal cycles above 90 days break most SMB-style dashboards. You need stage-aged coverage, multi-threading depth, and slipped-deal rate to see what's really happening.
- Bad contact data quietly corrupts almost every top-of-funnel metric. Fix the data layer before you argue about the dashboard.
What are enterprise sales metrics?#
Enterprise sales metrics are the KPIs that describe how a high-ACV, long-cycle, multi-stakeholder sales motion converts effort into contracted revenue. They differ from SMB or PLG metrics in three concrete ways.
First, the sales cycle is long enough that lagging indicators arrive too late to act on. If your average enterprise deal takes 140 days, a win rate measured this quarter reflects decisions made two quarters ago. Second, buying committees are large. Gartner's B2B buying research has consistently put the average enterprise buying group at six to ten people, which means single-contact deals are structurally fragile and "engaged accounts" matters more than "engaged leads." Third, ACV variance is enormous. One $900K deal can distort a quarterly average that includes forty $40K deals, so medians and cohort views beat simple averages almost everywhere.
The practical consequence: enterprise sales metrics have to be leading, account-level, and distribution-aware. A dashboard built on lagging, contact-level averages will tell you a comfortable story that is wrong.
Which enterprise sales metrics actually predict revenue?#
Here are the fourteen that survive a serious board review, grouped by what they answer.
- Pipeline coverage ratio (stage-weighted) — Open pipeline divided by quota, weighted by realistic stage conversion instead of rep optimism. Raw 3x coverage means nothing if two-thirds of it sits in stage one.
- Qualified pipeline creation rate — New pipeline dollars entering stage two or later, per week. This is the earliest honest signal of next-quarter revenue.
- Stage-to-stage conversion — The conversion percentage between each stage, tracked as a cohort. A single collapsing stage is usually where your real problem lives.
- Average sales cycle length by segment — Segment it by ACV band. Blending a 45-day mid-market cycle with a 210-day enterprise cycle produces a number that describes no actual deal.
- Win rate (qualified opportunities) — Wins divided by closed opportunities that passed qualification. Include losses to "no decision" separately; they're a different disease.
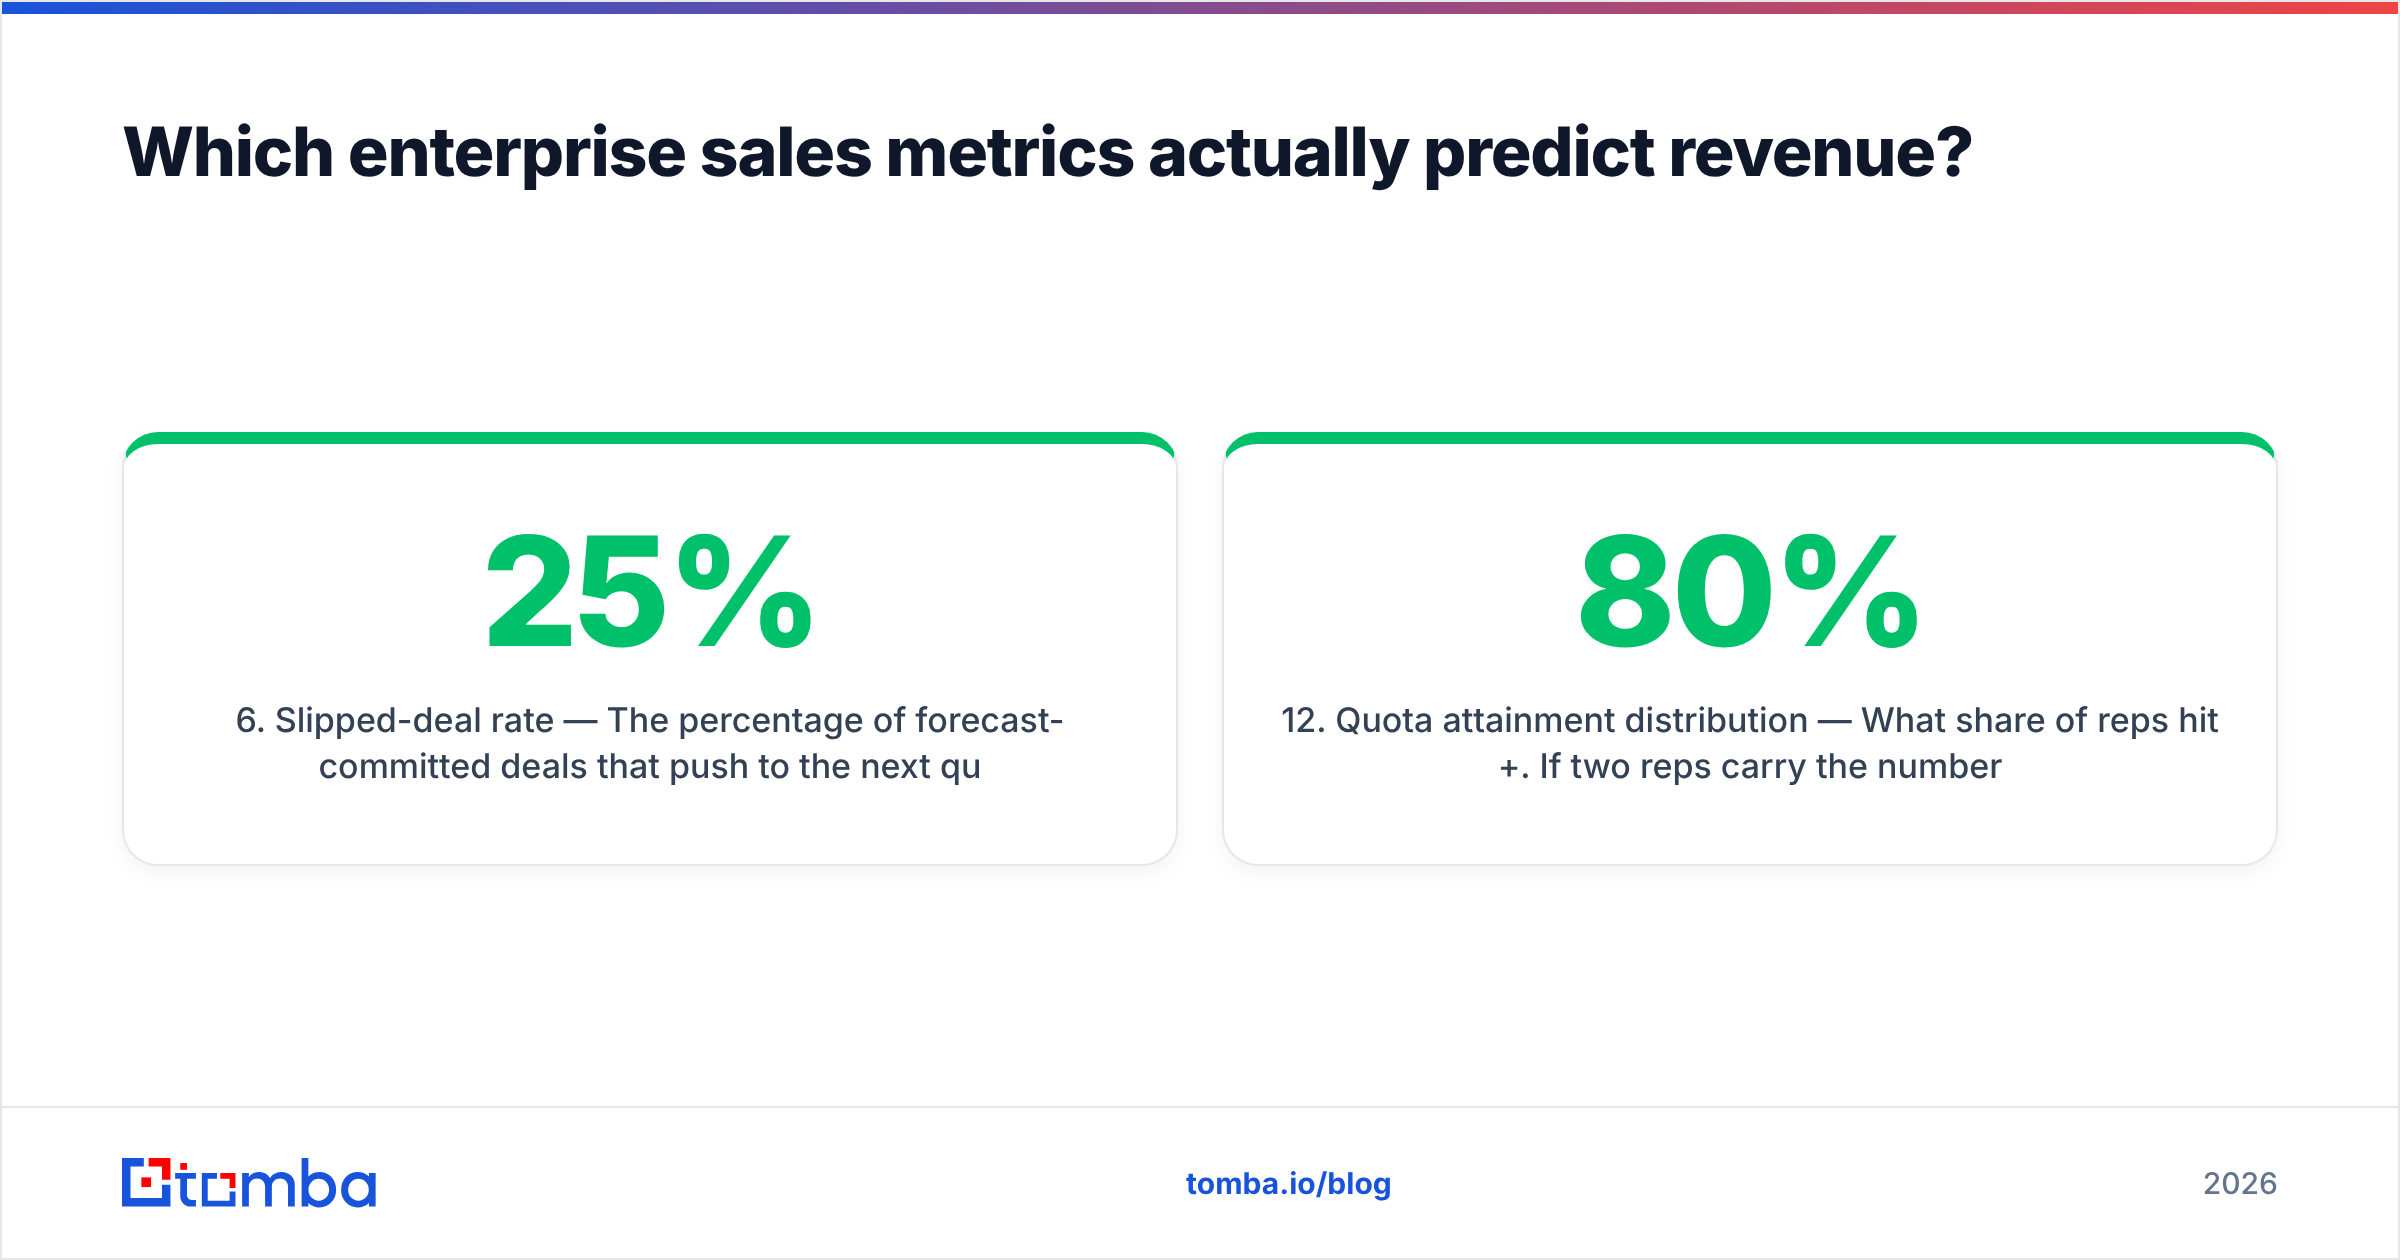
- Slipped-deal rate — The percentage of forecast-committed deals that push to the next quarter. Above 25%, your qualification criteria are decorative.
- Forecast accuracy (rolling variance) — Absolute variance between committed forecast and actual close, measured week four, week eight, and week twelve.
- Average contract value and ACV distribution — Track the median and the top-decile share, not just the mean.
- Multi-threading depth — Distinct contacts engaged per open opportunity. Deals with one contact lose at dramatically higher rates than deals with four or more.
- Net revenue retention (NRR) — Expansion minus churn and contraction across the installed base. In enterprise, NRR often out-earns new logo acquisition.
- CAC payback period — Fully loaded sales and marketing cost to acquire, divided by gross-margin-adjusted monthly recurring revenue.
- Quota attainment distribution — What share of reps hit 80%+. If two reps carry the number, you don't have a repeatable motion; you have two good reps.
- Ramp time to first closed-won — Median days from rep start to first deal. Directly gates how fast you can scale headcount.
- Cost per qualified opportunity — Total demand-gen plus SDR cost divided by SQOs. The metric that connects marketing spend to sales reality.
How do enterprise sales metrics differ from SMB metrics?#
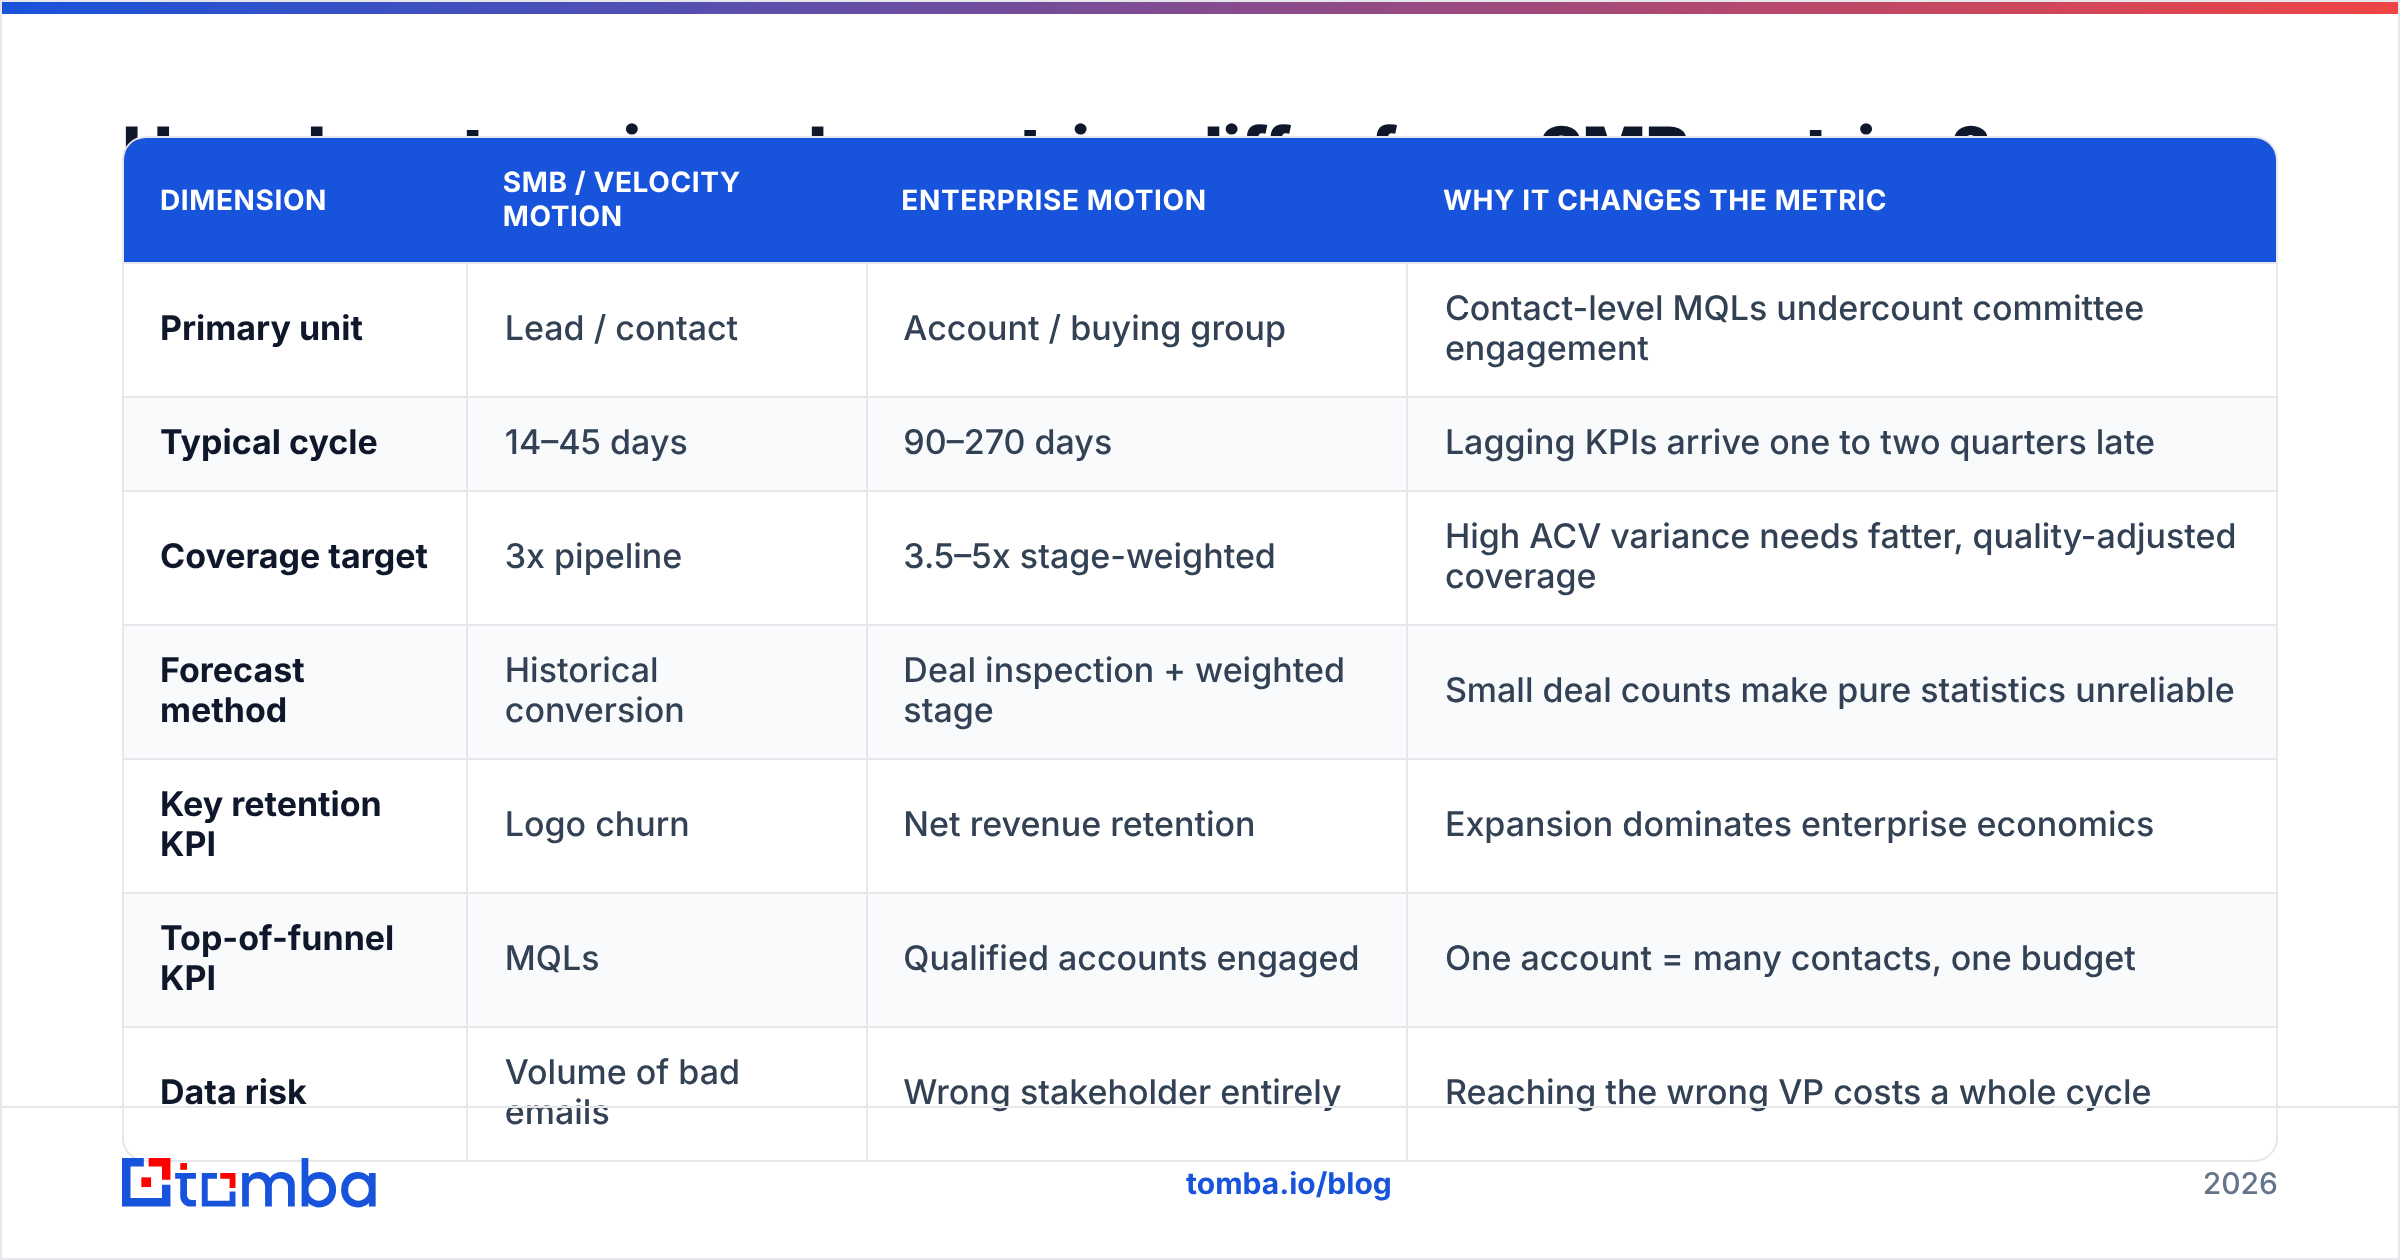
The mistake most teams make is importing an SMB dashboard into an enterprise motion and wondering why it stops predicting anything. Here's the concrete difference.
| Dimension | SMB / velocity motion | Enterprise motion | Why it changes the metric |
|---|---|---|---|
| Primary unit | Lead / contact | Account / buying group | Contact-level MQLs undercount committee engagement |
| Typical cycle | 14–45 days | 90–270 days | Lagging KPIs arrive one to two quarters late |
| Coverage target | 3x pipeline | 3.5–5x stage-weighted | High ACV variance needs fatter, quality-adjusted coverage |
| Forecast method | Historical conversion | Deal inspection + weighted stage | Small deal counts make pure statistics unreliable |
| Key retention KPI | Logo churn | Net revenue retention | Expansion dominates enterprise economics |
| Top-of-funnel KPI | MQLs | Qualified accounts engaged | One account = many contacts, one budget |
| Data risk | Volume of bad emails | Wrong stakeholder entirely | Reaching the wrong VP costs a whole cycle |
The row that matters most is the last one. In an SMB motion, a 12% bounce rate is an annoyance. In an enterprise motion, contacting the wrong three people at a target account can cost you a full quarter of cycle time, and no dashboard will flag it because the activity metrics all look healthy.
Why does forecast accuracy break in enterprise sales?#
Because most forecasts are built from stage probability, and stage probability is a rep-controlled input.
A rep moves a deal to "Negotiation" because the champion said "send over the paperwork." The CRM assigns 75%. The forecast rolls up. Nobody has verified that procurement is engaged, that security review has started, or that budget is actually allocated for this fiscal year. Three weeks later, the deal slips.
The fix is to replace subjective stage probability with objective exit criteria, then measure how often each criterion actually predicts a close.
- Define exit criteria per stage. Not "customer is interested" but "economic buyer has confirmed budget in writing" and "security questionnaire returned."
- Measure criterion-level predictive power. Some criteria correlate with wins; others are theater. After two quarters of data you'll know which is which.
- Track slipped-deal rate per rep. A rep with a 40% slip rate isn't lying — they're using different qualification standards than the rest of the team.
- Run rolling variance, not a single number. Report forecast accuracy at three checkpoints in the quarter. Accuracy that only converges in week twelve isn't a forecast, it's a countdown.
- Separate "lost to competitor" from "lost to no decision." They have different fixes. Competitive losses point at product or pricing; no-decision losses point at qualification and business-case construction.
Salesforce's own sales research and HubSpot's sales benchmarks both consistently show that teams with documented, objective exit criteria report materially tighter forecast variance than teams relying on rep-assigned percentages. That's not a tooling problem. It's a definition problem.

How does data quality corrupt your enterprise sales metrics?#
Every top-of-funnel metric you track is a ratio, and bad contact data poisons the denominator.
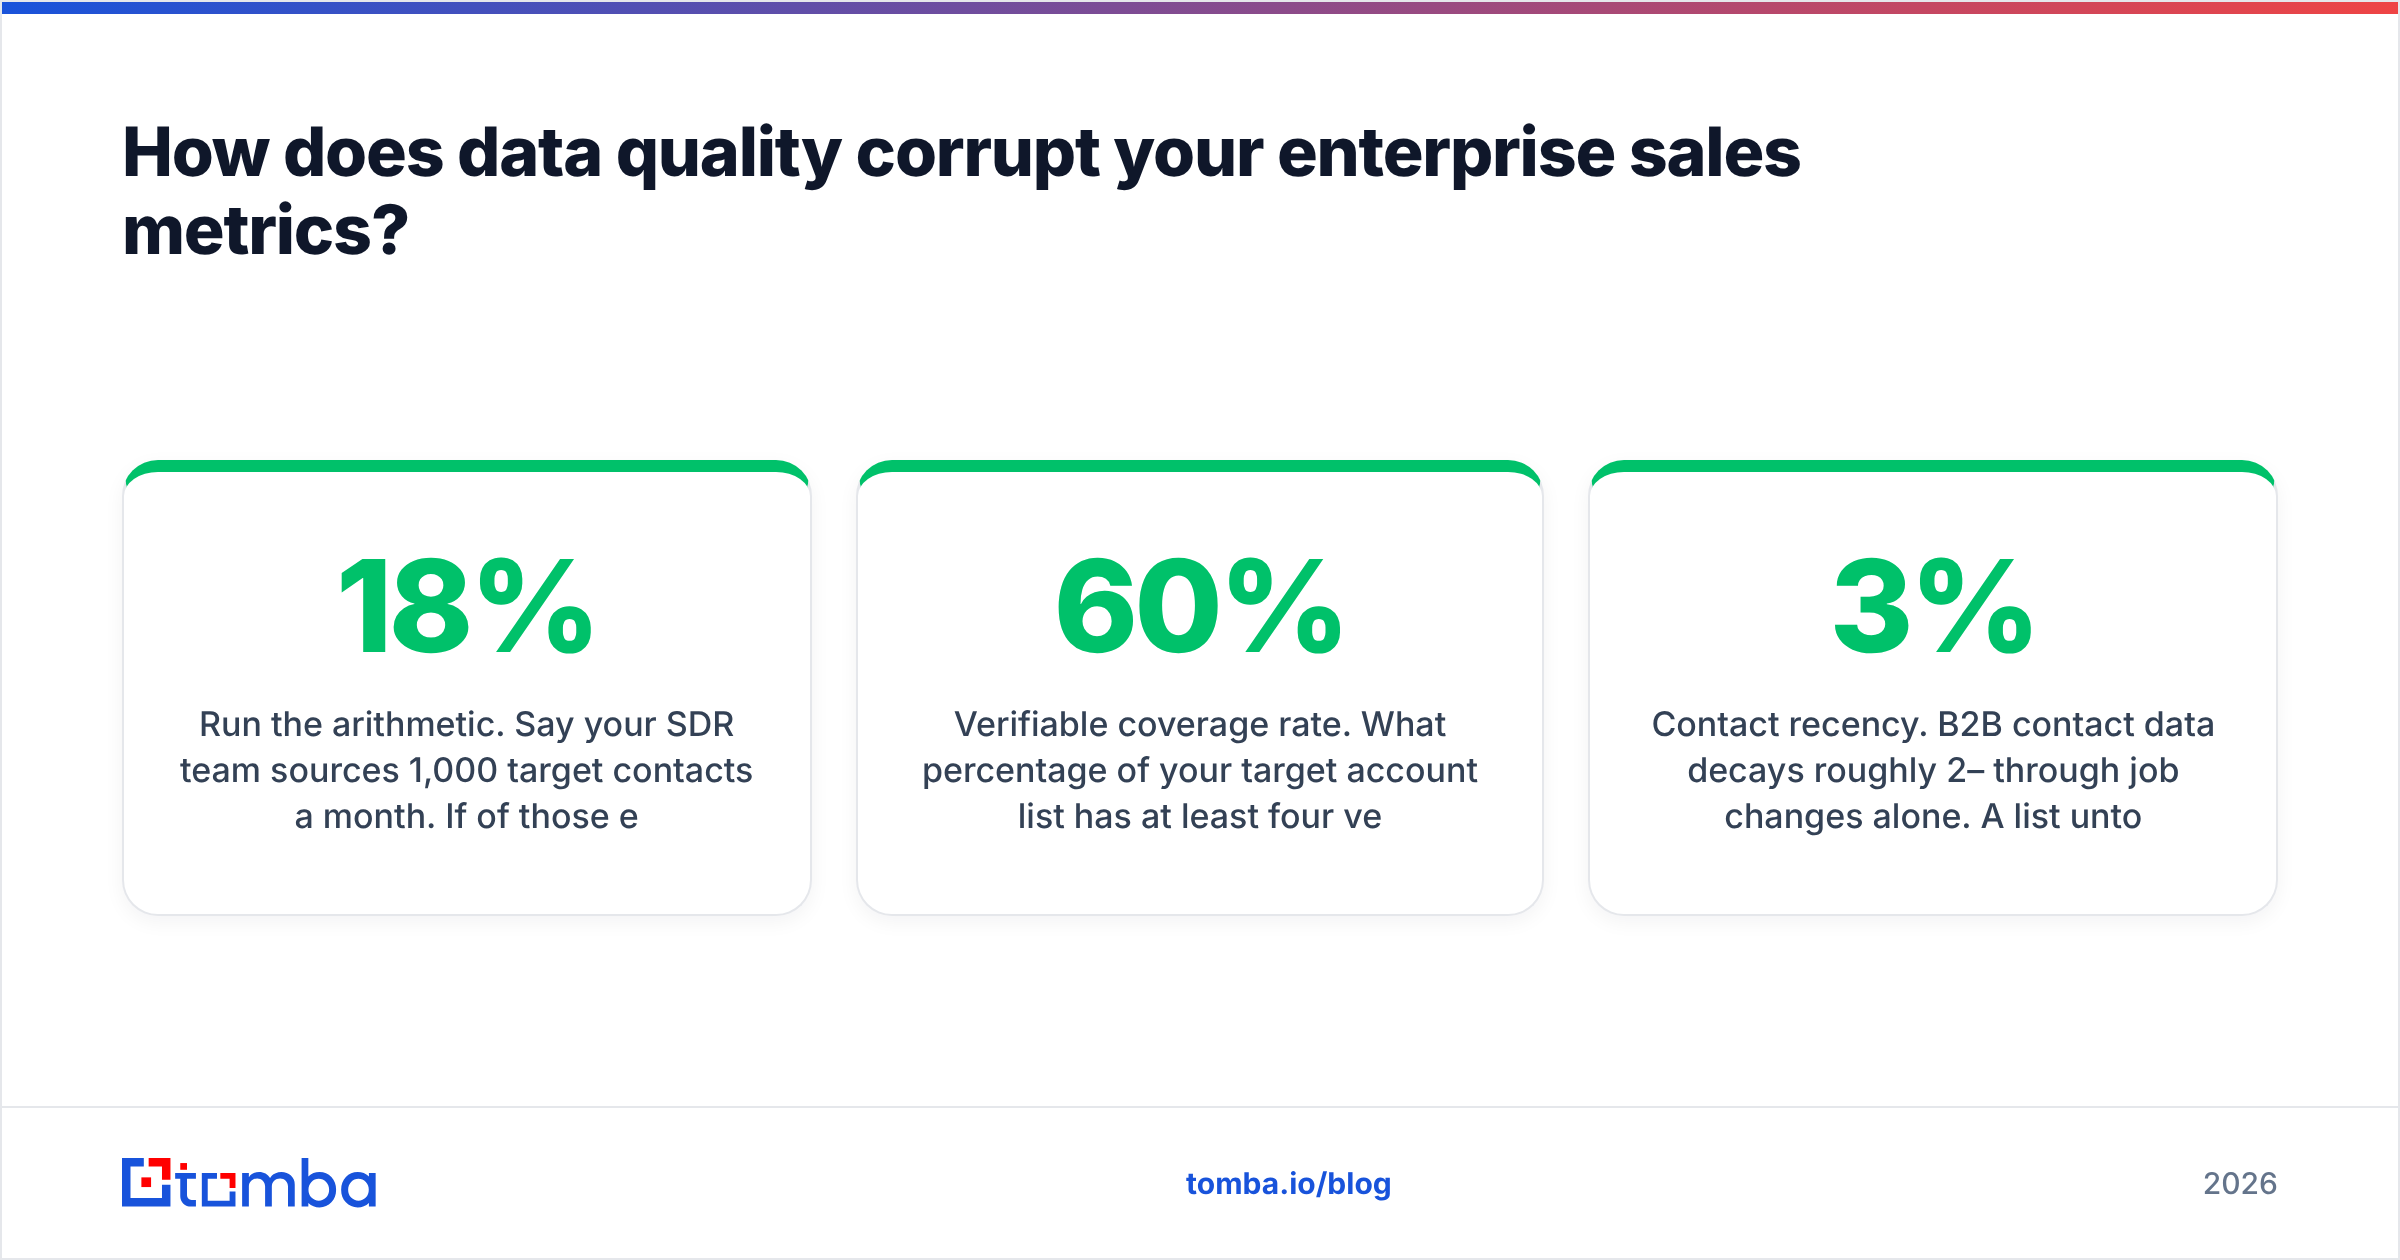
Run the arithmetic. Say your SDR team sources 1,000 target contacts a month. If 18% of those email addresses are invalid, stale, or belong to someone who left the company nine months ago, you have 180 sends that can never convert. Your reply rate looks 18% worse than reality. Your cost per qualified opportunity looks 22% higher. Your SDR productivity metric flags a coaching problem that doesn't exist. And your sender reputation degrades, which quietly suppresses deliverability for the 820 valid contacts too.
Now compound that across an enterprise motion where you need six to ten stakeholders per account. Missing three of the ten means your multi-threading depth metric reads "2.1 contacts per opportunity" when the real constraint is that you couldn't find the other stakeholders, not that reps failed to engage them.
Three data checks that should run before any metric review:
- Verifiable coverage rate. What percentage of your target account list has at least four verified, role-relevant contacts? Below 60%, your account-based metrics are guesses.
- Bounce rate by source. Segment by data vendor, scraper, or list purchase. One bad source usually accounts for most of the damage.
- Contact recency. B2B contact data decays roughly 2–3% per month through job changes alone. A list untouched for a year is roughly a quarter wrong.
This is where tooling actually earns its keep. Running your target account list through a domain search to map the full org, then a email verifier pass before any sequence launches, removes the largest single source of metric distortion in enterprise outbound. It costs less than one lost deal.
Which metrics should you review weekly, monthly, and quarterly?#
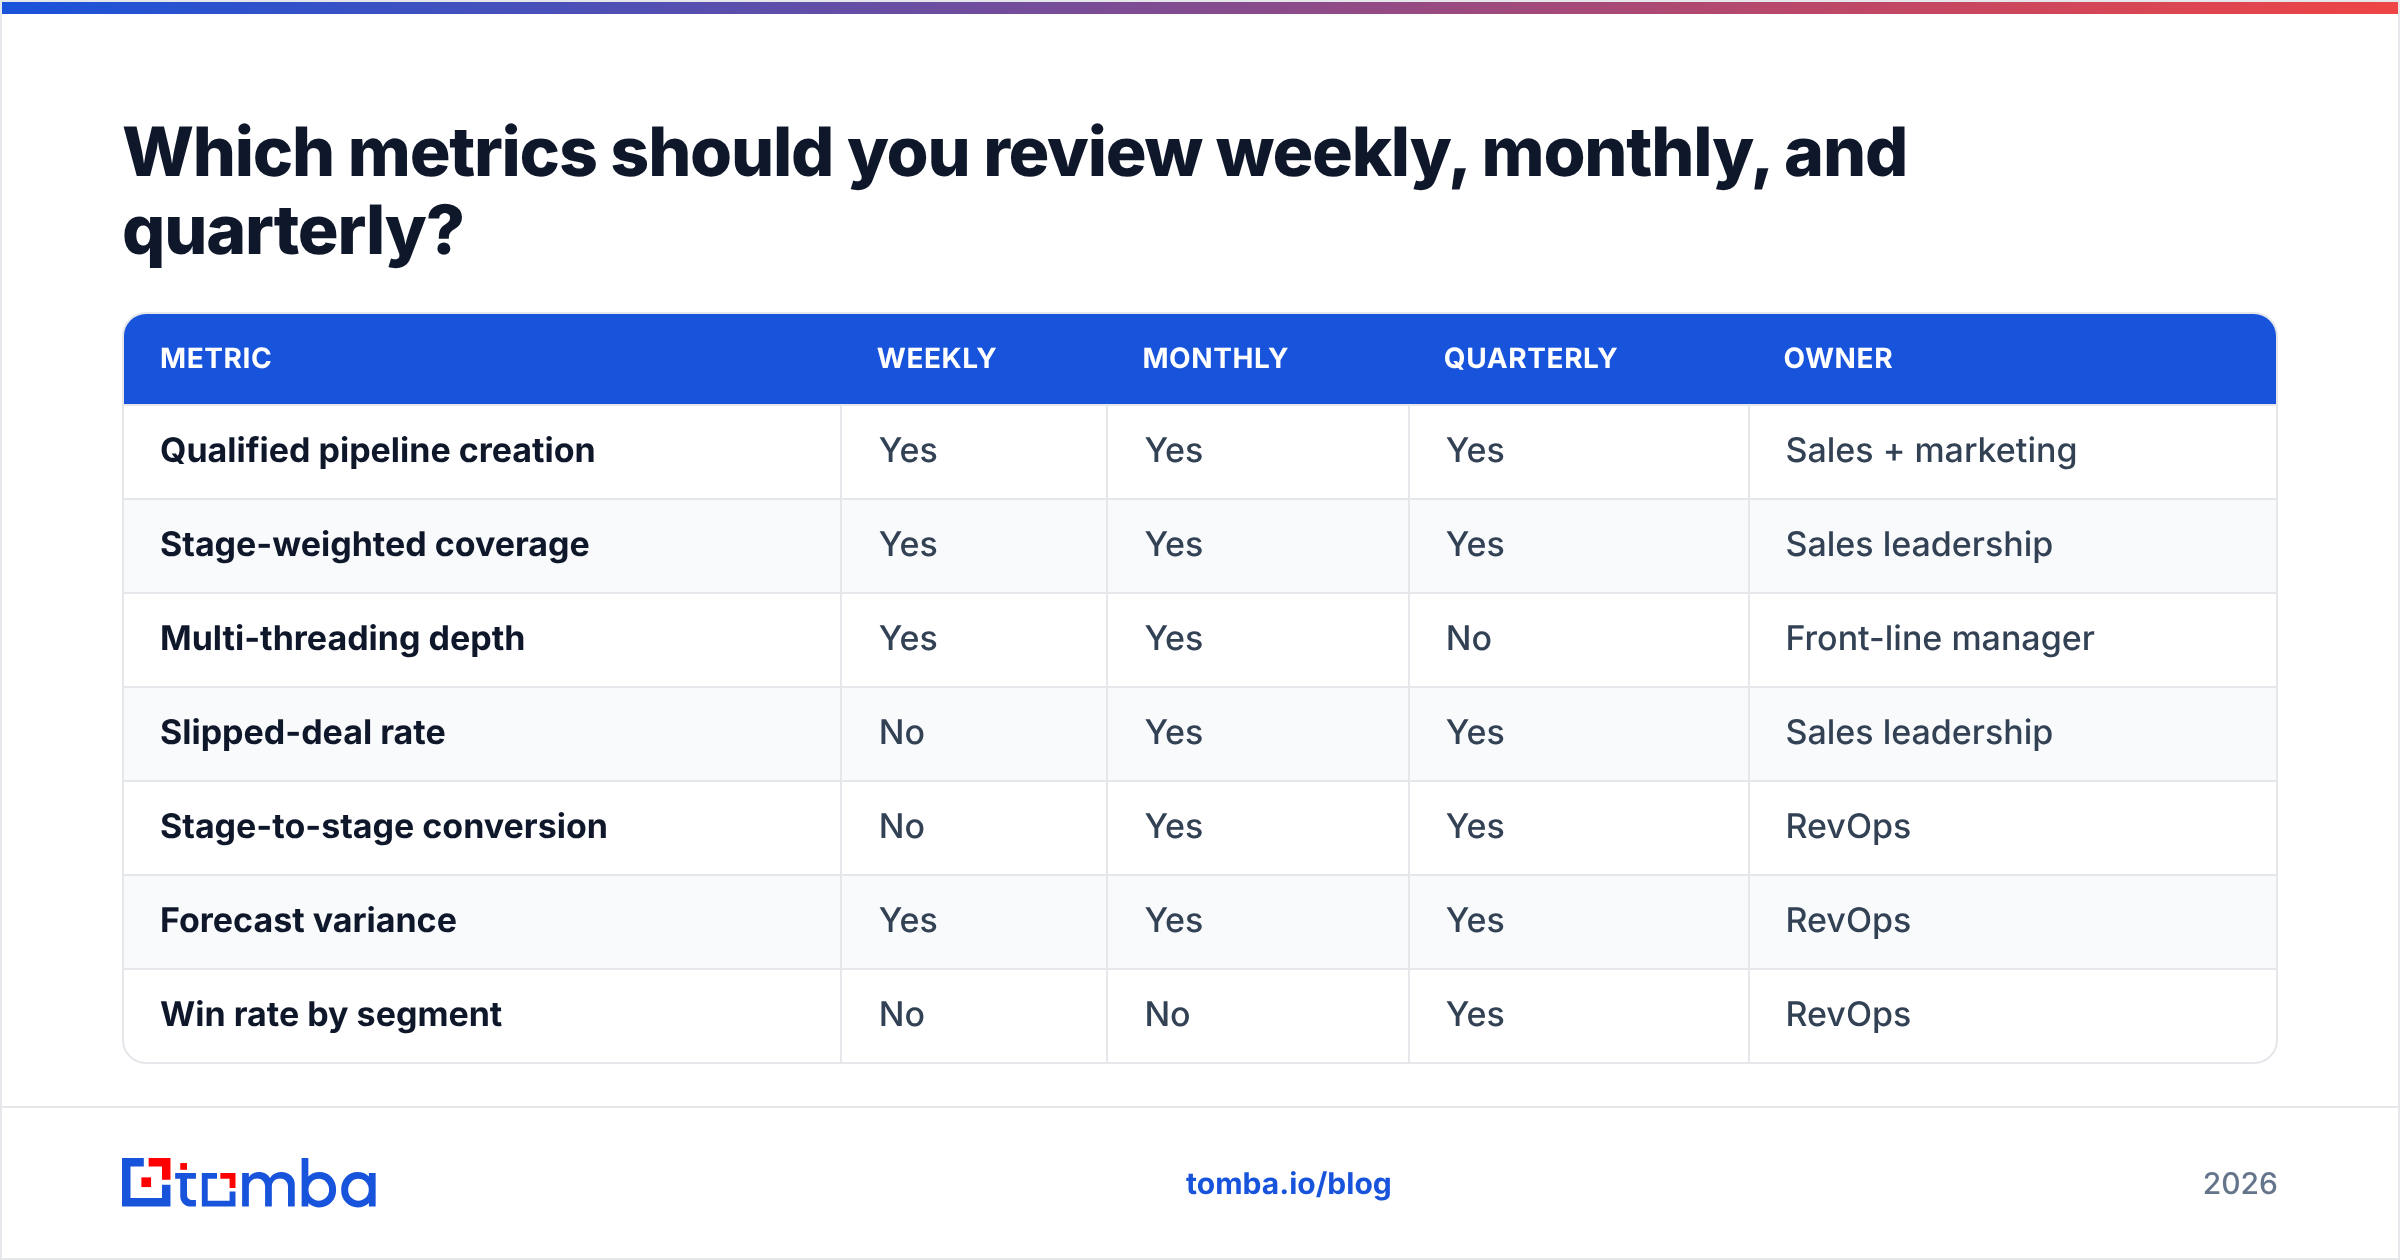
Cadence is the part most teams get wrong. They review everything monthly, which is too slow for leading indicators and too fast for lagging ones.
| Metric | Weekly | Monthly | Quarterly | Owner |
|---|---|---|---|---|
| Qualified pipeline creation | Yes | Yes | Yes | Sales + marketing |
| Stage-weighted coverage | Yes | Yes | Yes | Sales leadership |
| Multi-threading depth | Yes | Yes | No | Front-line manager |
| Slipped-deal rate | No | Yes | Yes | Sales leadership |
| Stage-to-stage conversion | No | Yes | Yes | RevOps |
| Forecast variance | Yes | Yes | Yes | RevOps |
| Win rate by segment | No | No | Yes | RevOps |
| Net revenue retention | No | No | Yes | CS + finance |
| CAC payback | No | No | Yes | Finance |
| Quota attainment spread | No | Yes | Yes | Sales leadership |
| Ramp time | No | No | Yes | Enablement |
| Cost per qualified opp | No | Yes | Yes | Marketing + RevOps |
The rule of thumb: review a metric at the frequency at which you can actually change it. Reviewing quarterly win rate every Monday produces anxiety, not action. Reviewing multi-threading depth weekly produces a specific coaching conversation about a specific open deal.
What benchmarks should you compare against?#
Be careful here. Published benchmarks are useful as sanity checks and dangerous as targets, because they aggregate wildly different motions.
Reasonable ranges for enterprise B2B SaaS, drawn from vendor benchmark reports and peer review sites like G2 and Gartner's sales practice:
- Win rate on qualified opportunities: 15–30%. Above 40% usually means you're qualifying too late, not selling brilliantly.
- Stage-weighted pipeline coverage: 3.5–5x for enterprise, higher early in the fiscal year.
- Forecast variance at week four: within 20% is strong; within 10% at week eight is excellent.
- Net revenue retention: 100% is table stakes, 110–120% is healthy, above 130% typically indicates usage-based pricing rather than superior retention.
- CAC payback: 12–24 months for enterprise. Beyond 30, growth is being financed rather than earned.
- Ramp to first closed-won: 90–150 days depending on cycle length.
Your own trailing four-quarter numbers are a better benchmark than any of these. Comparative benchmarks tell you whether you're in the right neighborhood; your own trend tells you whether you're improving.
How do you build the metric stack without drowning in tools?#
Start with the data layer, then the CRM hygiene layer, then reporting. Teams that reverse this order end up with beautiful dashboards over garbage inputs.
The minimum viable enterprise metric stack looks like: a verified contact and account data source, a CRM with enforced stage exit criteria, a revenue operations function that owns definitions, and a BI layer that nobody edits without a change log. That's it. Four layers. Most companies add six more and get worse numbers.
If your bottleneck is layer one — you can't reliably reach the full buying committee at your target accounts — that's where to spend first. Tomba's Email Finder maps verified contacts across a target domain so your multi-threading and coverage metrics reflect real reach instead of data gaps, with a free tier at 25 searches a month and paid Tomba plans starting at $49/mo. Fix the inputs, and every downstream enterprise sales metric on your dashboard starts telling the truth.
Related guides#
Ready to find emails that actually work?
Join 150,000+ professionals who stopped guessing and started sending. Free credits on signup — no credit card required.
Get the Tomba newsletter
Practical outbound tactics and product updates — once every two weeks.
About the author