Firmographic Data: The 2026 Guide to B2B Company Targeting
Firmographic data is the backbone of B2B segmentation — but most teams collect the wrong fields and let them rot. Here's what actually matters, where to source it, and how to keep it accurate in 2026.
TL;DR
- Firmographic data describes the company — industry, size, revenue, location, ownership, growth stage — as opposed to technographic (what they run) or intent data (what they're researching).
- Six fields do most of the work: industry code, employee count, revenue band, headquarters country, funding stage, and headcount growth rate. Everything else is decoration until those six are clean.
- Firmographic records decay fast. Employee counts shift quarterly, domains change on acquisition, and roughly a quarter of a B2B record goes stale within 12 months.
- The cheapest accuracy win is not buying more data — it's re-verifying the contact layer sitting on top of it. A perfect ICP match with a bounced email is still a wasted send.
- Build your segmentation on 4–6 durable attributes, refresh on a 90-day cycle, and treat every vendor's employee count as a range, not a number.
What is firmographic data?#
Firmographic data is demographic data for companies. Where B2C marketers segment by age, income, and zip code, B2B teams segment by industry, headcount, revenue, and location. The term dates back to direct-mail list buying in the 1980s and survived because the underlying idea holds: companies with similar shapes tend to buy in similar ways.
The practical definition is narrower than most vendors imply. Firmographics are the stable structural attributes of an organization — things that change on a quarterly-or-slower cadence and can be verified from public or semi-public sources. A company's SIC code is firmographic. The fact that three of their engineers visited your pricing page last Tuesday is not; that's intent data wearing a firmographic costume.
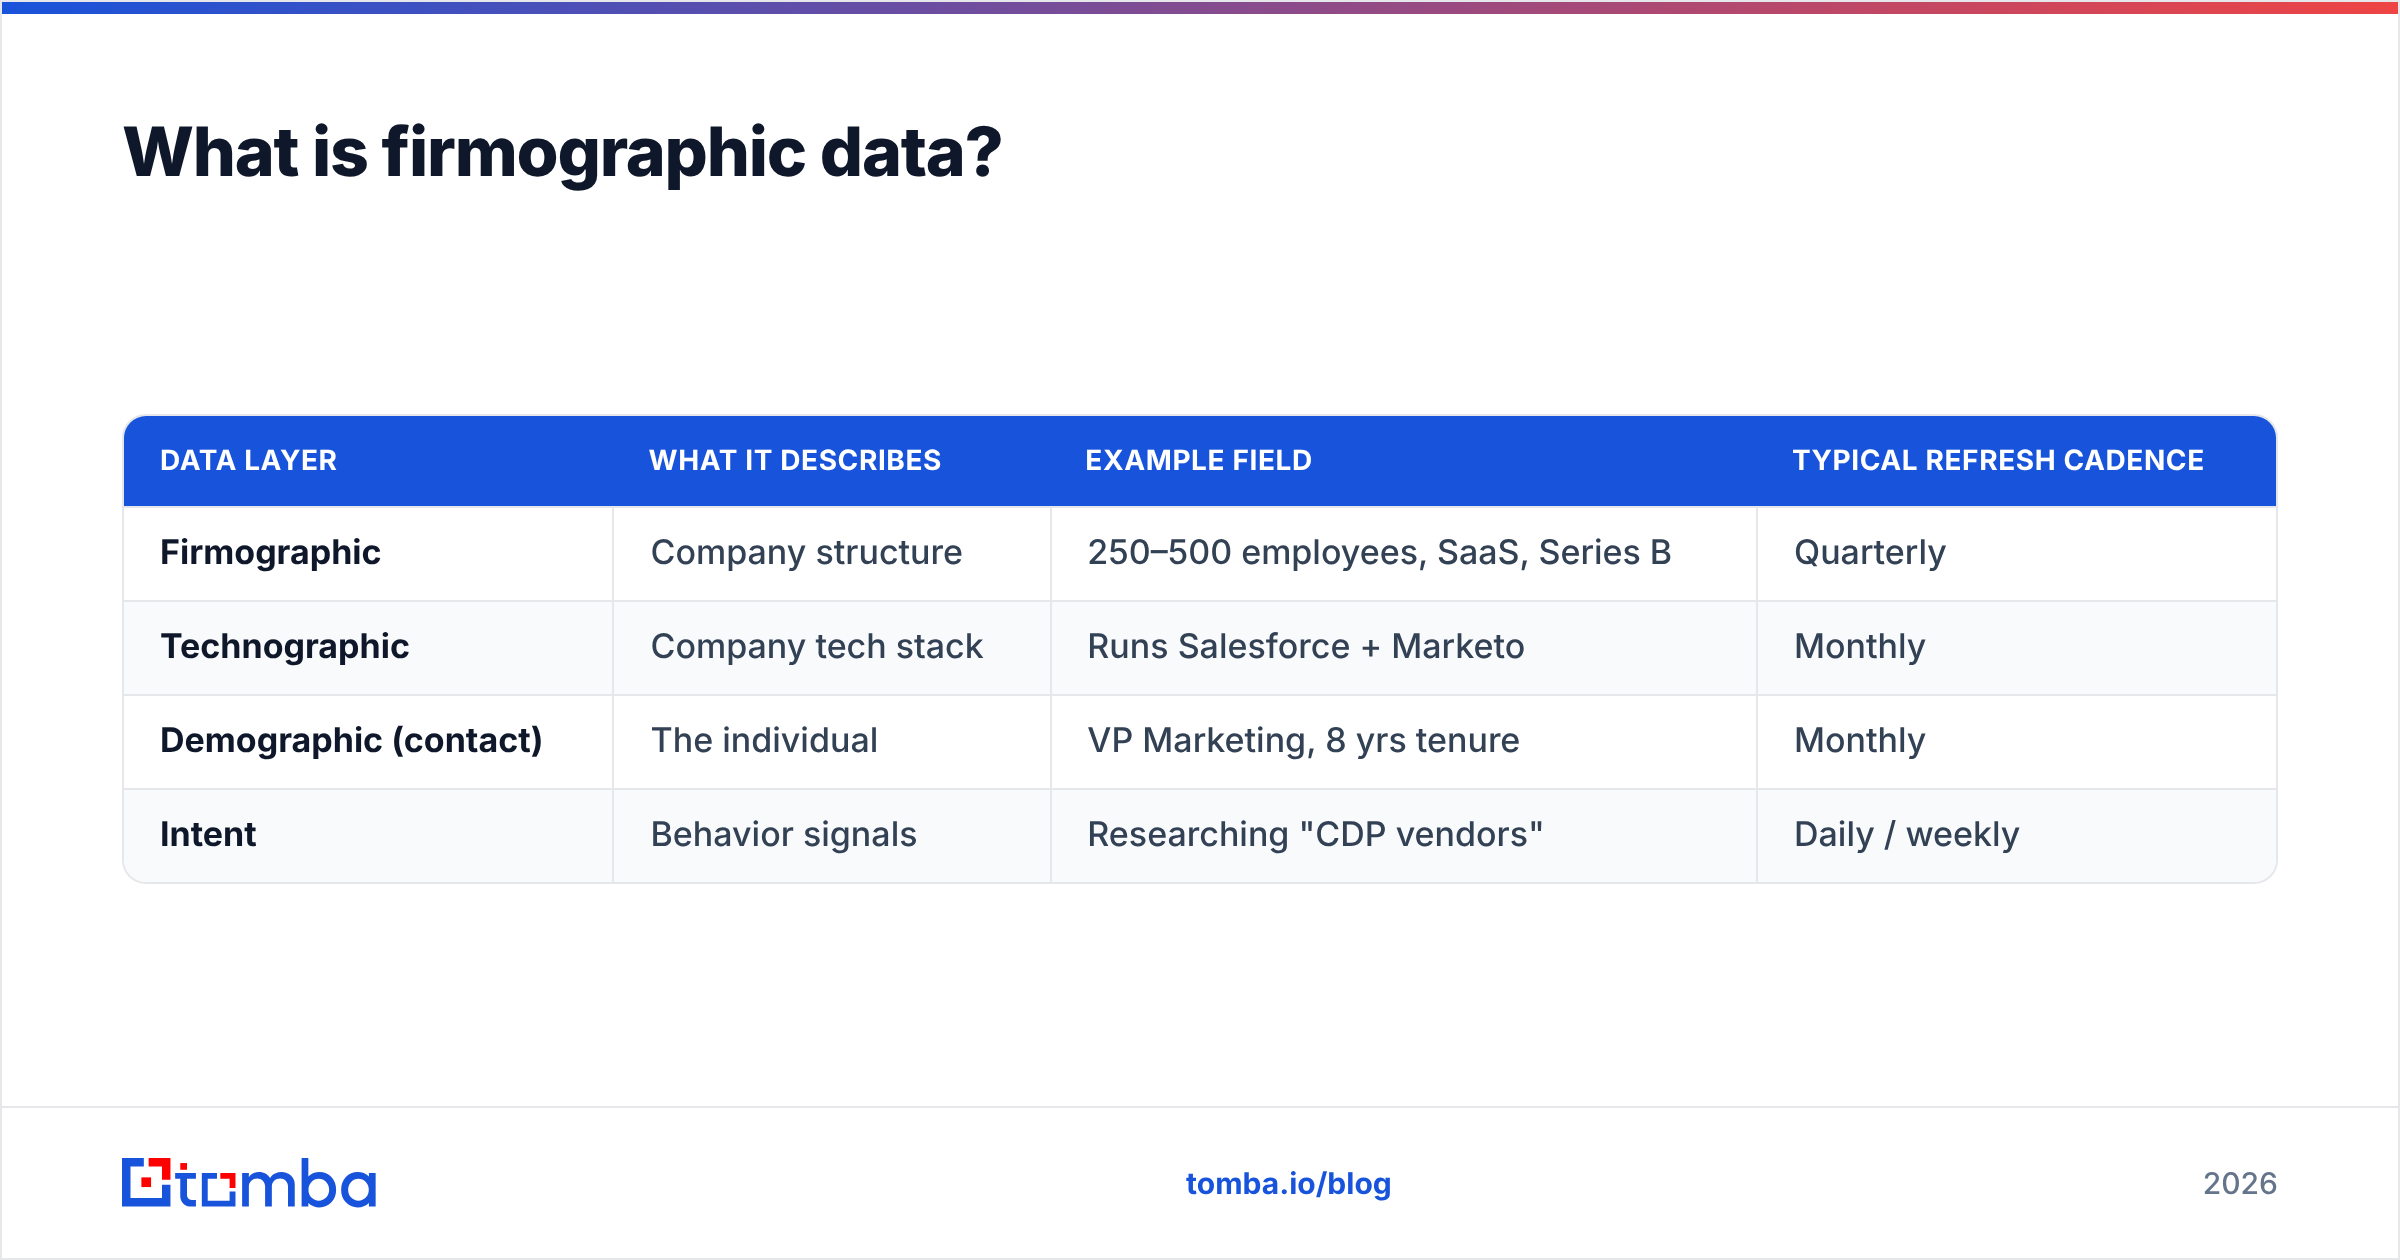
Here's how the four common B2B data layers separate:
| Data layer | What it describes | Example field | Typical refresh cadence |
|---|---|---|---|
| Firmographic | Company structure | 250–500 employees, SaaS, Series B | Quarterly |
| Technographic | Company tech stack | Runs Salesforce + Marketo | Monthly |
| Demographic (contact) | The individual | VP Marketing, 8 yrs tenure | Monthly |
| Intent | Behavior signals | Researching "CDP vendors" | Daily / weekly |
Most GTM failures blamed on "bad data" are actually layer confusion — teams score accounts on intent signals while their firmographic base is two years old, then wonder why the sales team rejects the leads.
Which firmographic fields actually predict revenue?#
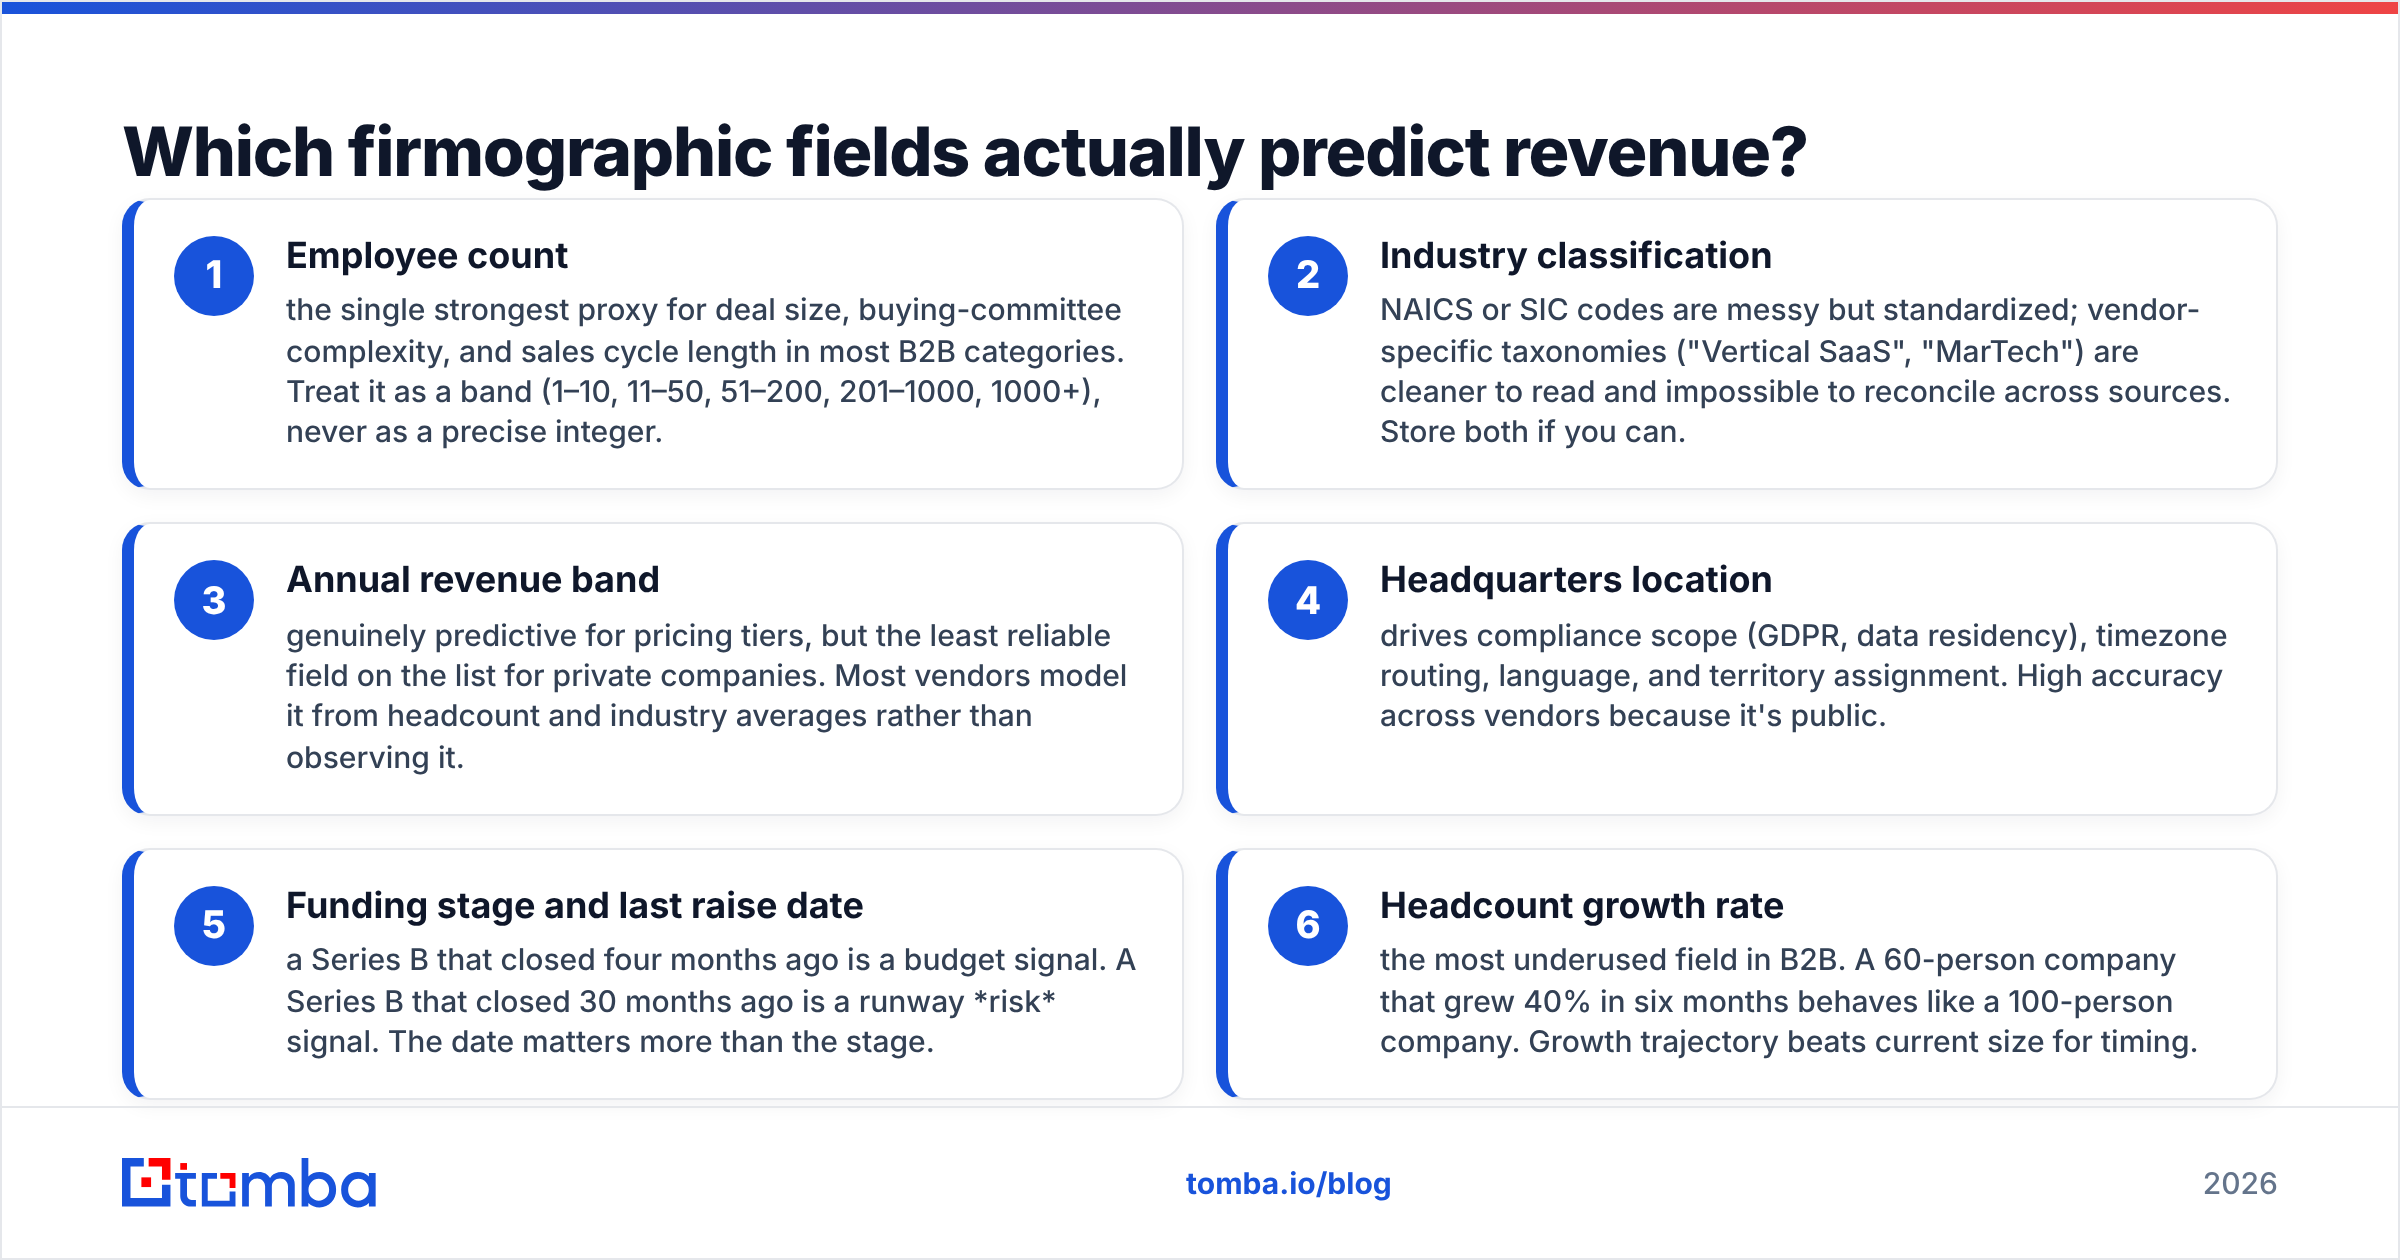
Not all of them. Vendors advertise 50–100 firmographic attributes per company record; in practice a handful carry nearly all the segmentation signal.
- Employee count — the single strongest proxy for deal size, buying-committee complexity, and sales cycle length in most B2B categories. Treat it as a band (1–10, 11–50, 51–200, 201–1000, 1000+), never as a precise integer.
- Industry classification — NAICS or SIC codes are messy but standardized; vendor-specific taxonomies ("Vertical SaaS", "MarTech") are cleaner to read and impossible to reconcile across sources. Store both if you can.
- Annual revenue band — genuinely predictive for pricing tiers, but the least reliable field on the list for private companies. Most vendors model it from headcount and industry averages rather than observing it.
- Headquarters location — drives compliance scope (GDPR, data residency), timezone routing, language, and territory assignment. High accuracy across vendors because it's public.
- Funding stage and last raise date — a Series B that closed four months ago is a budget signal. A Series B that closed 30 months ago is a runway risk signal. The date matters more than the stage.
- Headcount growth rate — the most underused field in B2B. A 60-person company that grew 40% in six months behaves like a 100-person company. Growth trajectory beats current size for timing.

Fields that sound useful and mostly aren't: number of office locations, fiscal year end, parent-company hierarchy (unless you sell to the enterprise), and "company description" free text. They inflate the record count on a vendor's feature page and add noise to your scoring model.
Where does firmographic data come from?#
Understanding sourcing tells you which fields to trust. Every provider blends some mix of these:
- Public registries and filings — company registrars, SEC EDGAR, Companies House. Highly accurate, slow to update, legal-entity-shaped rather than brand-shaped.
- Web crawling — careers pages, about pages, footers, press releases. Fast, broad coverage, prone to parsing errors (a franchise page listing 400 locations becomes "400 employees").
- Professional network scraping and licensed feeds — the source of most headcount figures. Reflects profiles, not payroll, so it over-counts in tech and under-counts in manufacturing, logistics, and healthcare.
- User contribution and network effects — CRM sync, email-signature parsing, contributed contact books. Excellent freshness on the accounts your userbase actually touches, thin everywhere else.
- Modeled/inferred fields — revenue estimates, growth predictions. These are statistical guesses. Useful for bucketing, dangerous for quoting.
Ask any vendor which of these five produced a given field. If they can't answer, the field is modeled. Tomba publishes its data sources openly, which is the baseline you should expect from anyone you buy from — and it's a reasonable check to run against providers listed on G2 before you commit to a contract.
How fast does firmographic data decay?#
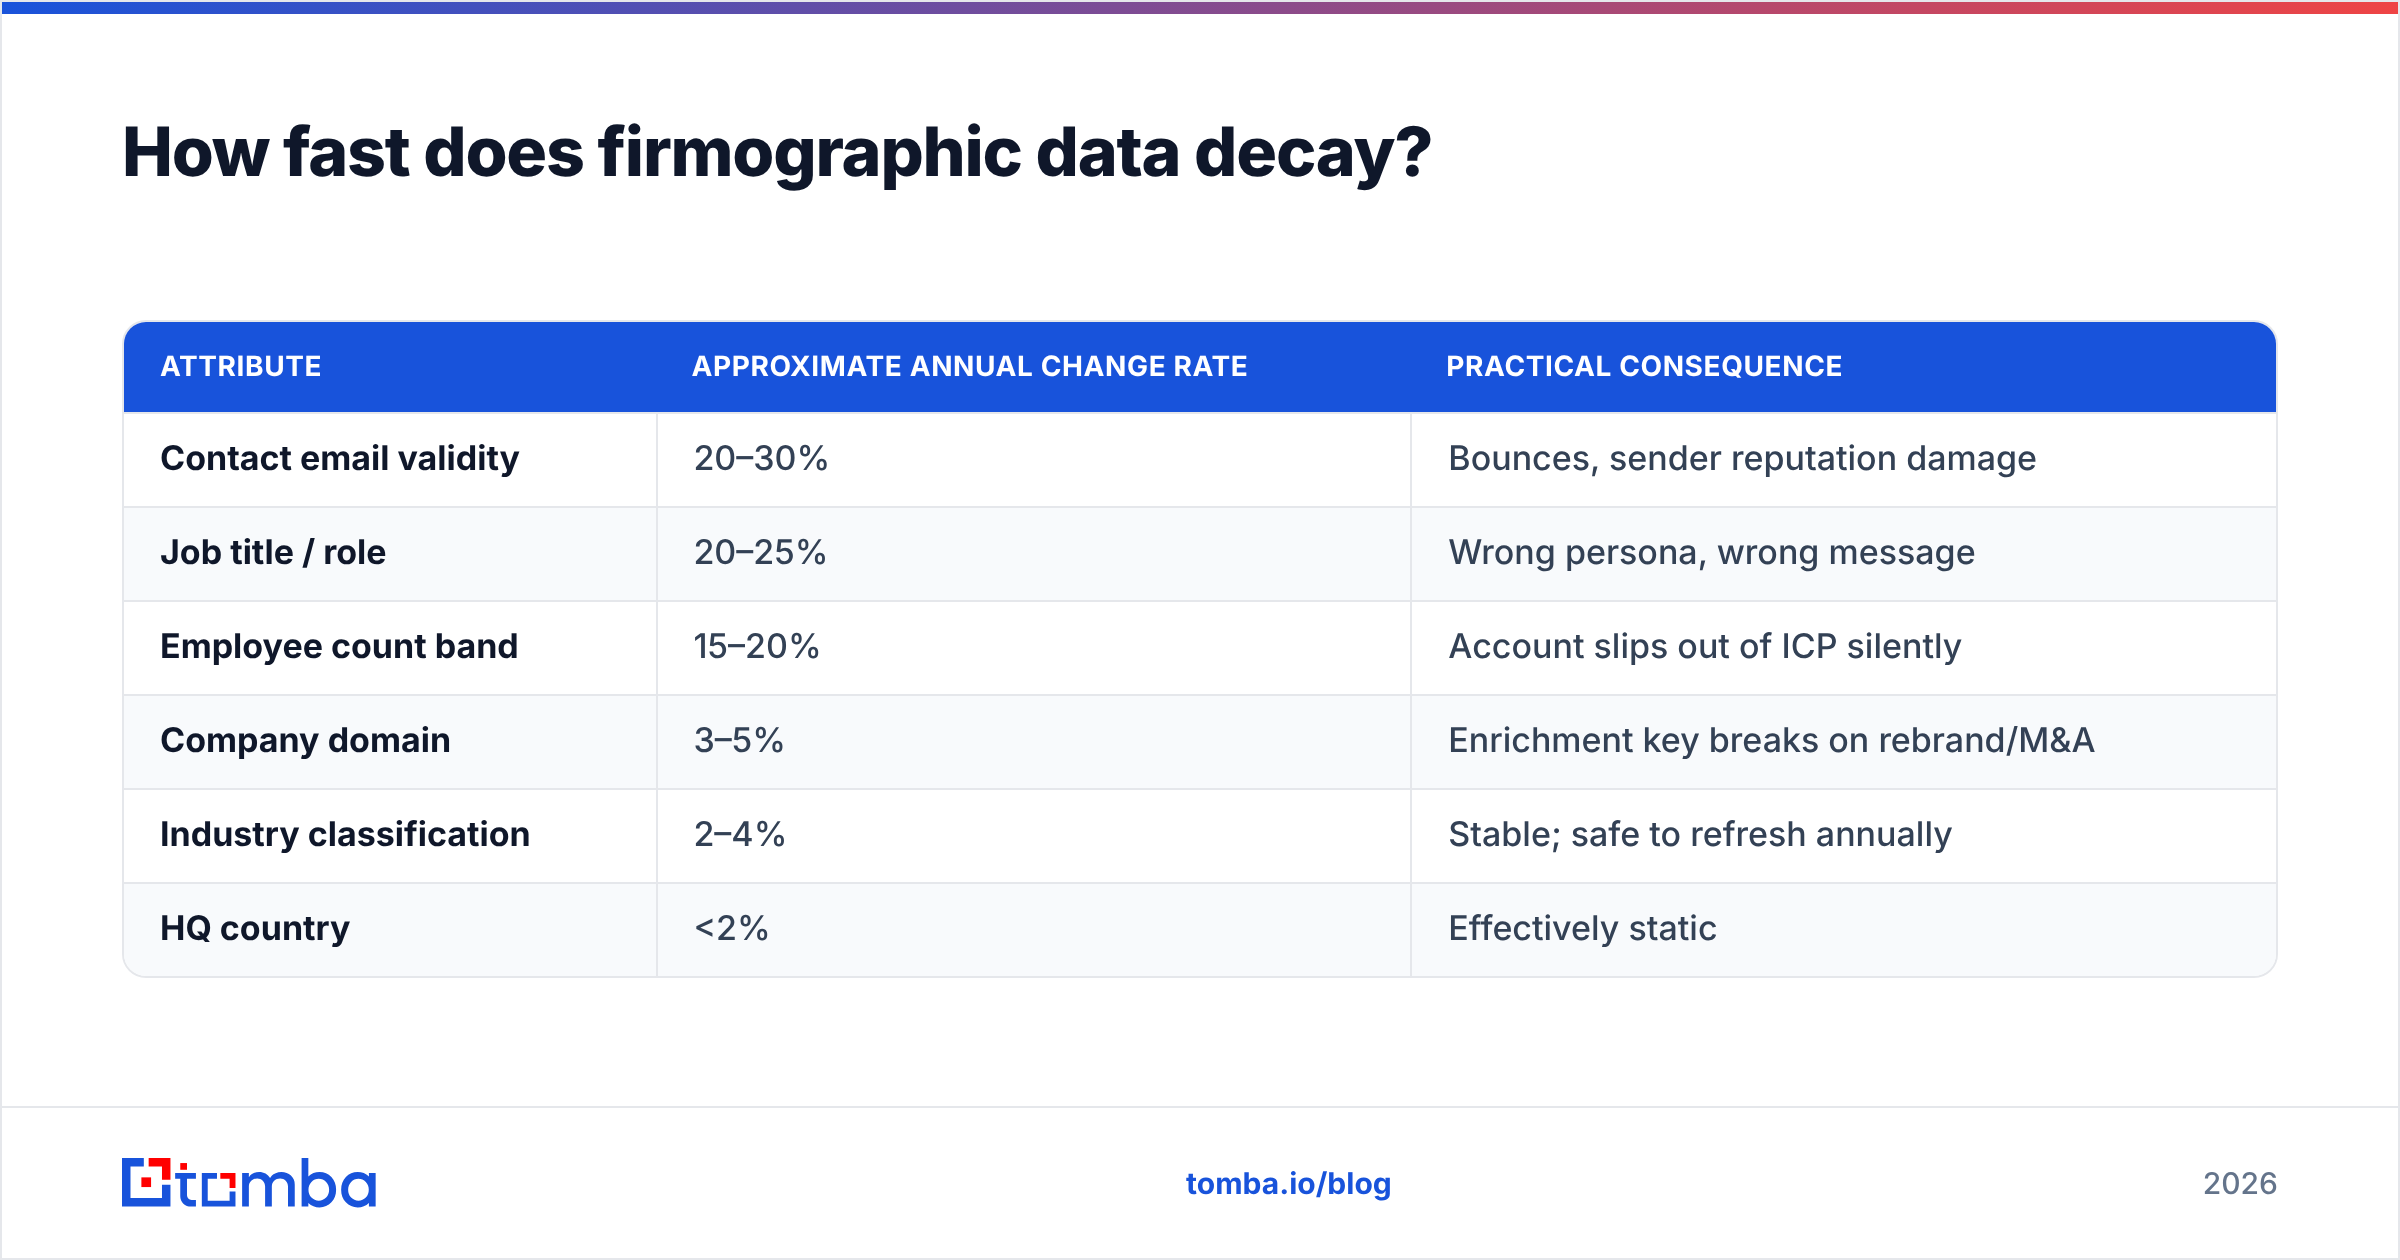
Faster than budgets assume. The rough annual movement in a typical B2B record:
| Attribute | Approximate annual change rate | Practical consequence |
|---|---|---|
| Contact email validity | 20–30% | Bounces, sender reputation damage |
| Job title / role | 20–25% | Wrong persona, wrong message |
| Employee count band | 15–20% | Account slips out of ICP silently |
| Company domain | 3–5% | Enrichment key breaks on rebrand/M&A |
| Industry classification | 2–4% | Stable; safe to refresh annually |
| HQ country | <2% | Effectively static |
Two things follow from this table. First, the volatile layer is the contact layer, not the company layer — which is why the highest-ROI hygiene step is running your list through an email verifier before every campaign rather than re-buying company records. Second, employee-count drift is the silent killer: an account that was a perfect 200-person fit at purchase can be a 90-person fit or a 600-person fit a year later, and nothing in your CRM will flag it.
Set a 90-day refresh on employee count and funding date, a 12-month refresh on industry and location, and continuous verification on emails and phone numbers.
How do you build an ICP from firmographic data?#
Start narrow and evidence-based rather than aspirational. The process that works:
- Pull your last 50 closed-won deals and append firmographic fields to each. Not your target list — your actual customers.
- Find the clustering — look for bands where win rate and ACV are both above average. You are looking for 2–3 attribute combinations, not 9.
- Check the losses — pull closed-lost and churned accounts through the same fields. Any attribute that appears equally in wins and losses is not a qualifier; drop it.
- Write the ICP as a filter, not a paragraph — "US/UK B2B SaaS, 50–500 employees, raised within 24 months" is executable. "Innovative mid-market companies who value data" is not.
- Size the market — count how many companies actually match. If the answer is 400, your ICP is too tight for a volume outbound motion. If it's 400,000, you haven't segmented.
- Re-run quarterly — as you move upmarket or add products, the winning bands shift. An ICP defined once is an ICP that's wrong by year two.

The output of this exercise should feed directly into how you source contacts. Once you know the shape, a domain search across matching company domains turns the abstract segment into an actionable list of named people, and data enrichment fills in the firmographic and contact fields you're missing on records you already own.
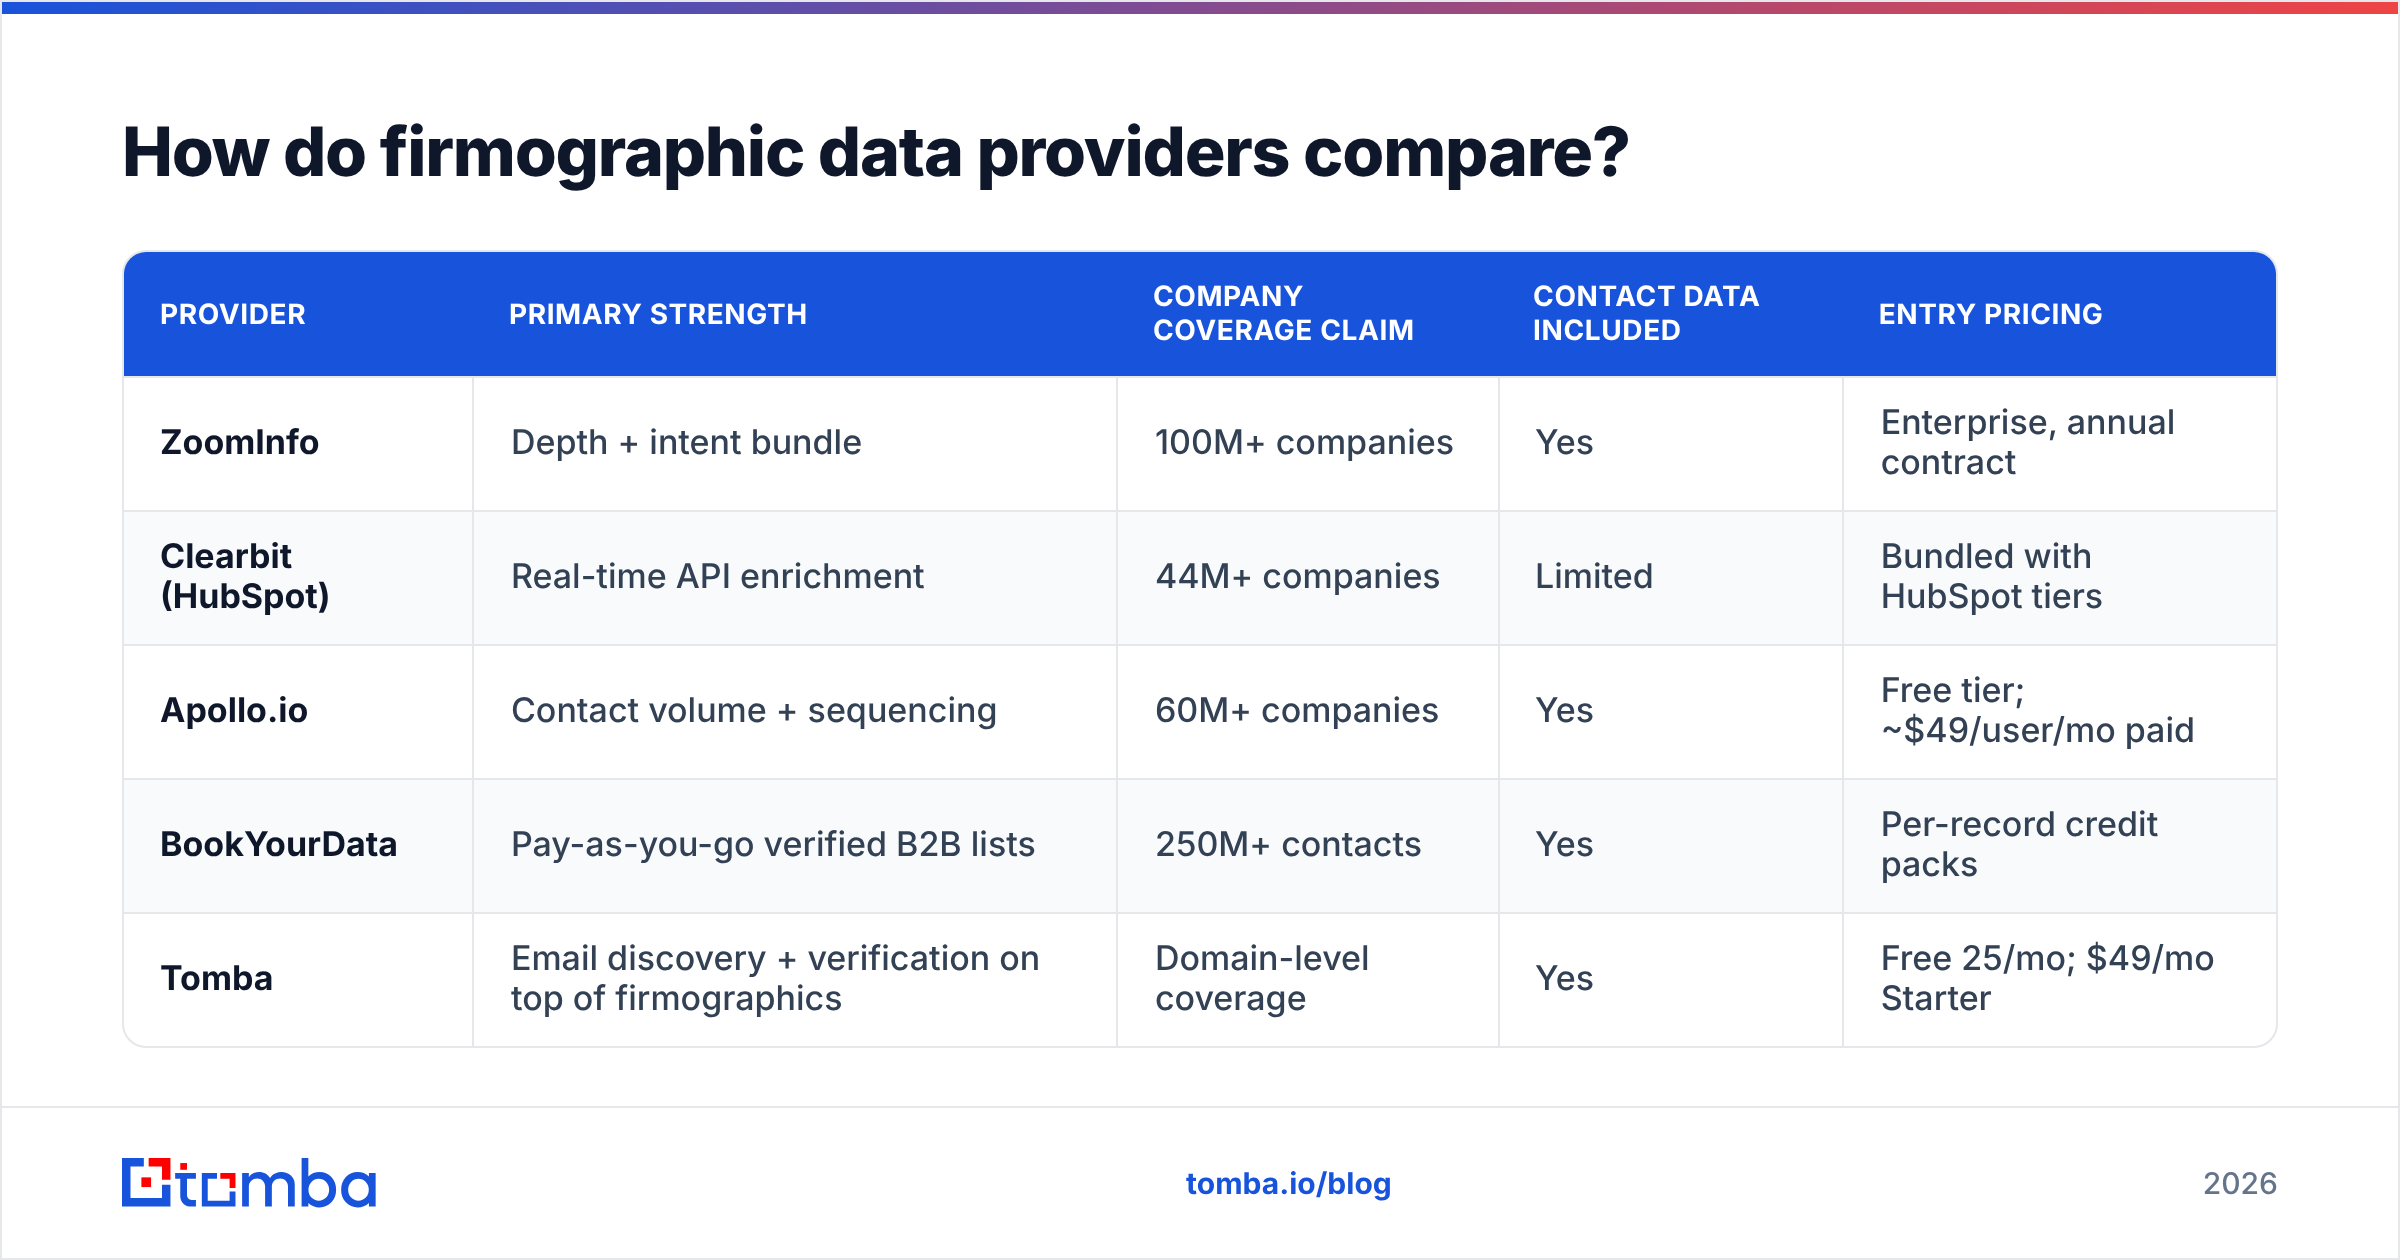
How do firmographic data providers compare?#
Provider choice depends on whether you need breadth (how many companies), depth (how many fields per company), or the contact layer on top. Very few vendors do all three well, and the ones that claim to are usually reselling.
| Provider | Primary strength | Company coverage claim | Contact data included | Entry pricing |
|---|---|---|---|---|
| ZoomInfo | Depth + intent bundle | 100M+ companies | Yes | Enterprise, annual contract |
| Clearbit (HubSpot) | Real-time API enrichment | 44M+ companies | Limited | Bundled with HubSpot tiers |
| Apollo.io | Contact volume + sequencing | 60M+ companies | Yes | Free tier; ~$49/user/mo paid |
| BookYourData | Pay-as-you-go verified B2B lists | 250M+ contacts | Yes | Per-record credit packs |
| Tomba | Email discovery + verification on top of firmographics | Domain-level coverage | Yes | Free 25/mo; $49/mo Starter |
A few honest notes on that table. ZoomInfo remains the most complete single record if budget is not the constraint, but the annual-contract floor prices out most teams under 20 seats. Clearbit's strength is API-shaped enrichment at the moment of form-fill, not list building. Apollo is the volume play and its firmographic depth is thinner than its contact count suggests — see our Apollo alternative breakdown for the field-by-field comparison. BookYourData is a solid fit when you want verified lists without a platform subscription, especially for teams that buy in bursts rather than running a continuous enrichment pipeline.
Tomba's position is specific and worth stating plainly: it is not a firmographic database in the ZoomInfo sense. It's the layer that turns a firmographic target list into reachable contacts — finding and verifying the email addresses at companies you've already qualified. If your problem is "I know which 3,000 companies to target and need the right people at them," that's the fit. If your problem is "I need revenue estimates for 200,000 private companies," it isn't.
What are the common firmographic mistakes?#
Treating modeled revenue as fact. Private-company revenue figures are almost always estimates derived from headcount × industry-average revenue-per-employee. Use them for bucketing. Never put one in a slide shown to the prospect.
Segmenting on legal entity instead of buying unit. A 40,000-person conglomerate contains dozens of independent buying units of 200 people each. If your enrichment resolves everything to the parent, your ICP filter will reject perfectly good accounts — or route them to enterprise reps who can't sell a $12k contract.
Over-segmenting. Nine-attribute ICPs feel rigorous and produce segments of 300 companies that can't sustain a pipeline. Four to six attributes is the working range.
Ignoring the classification mismatch. NAICS was built for statistical reporting, not for GTM. "Software Publishers" (511210) lumps a payroll platform in with a mobile game studio. Layer a vendor taxonomy or your own tags on top for anything requiring nuance.
Enriching without verifying. This is the expensive one. Firmographic enrichment appends company fields; it does not confirm that the email address attached to the record still routes to a human. Sending to unverified addresses degrades sender reputation and takes weeks to recover from. Enrichment and verification are separate steps and both are mandatory.
Buying coverage you'll never use. A 100M-company database is irrelevant if your ICP contains 8,000 accounts. Evaluate providers on accuracy within your segment, not total record count. Run a 200-record sample against known-good data before signing anything — most vendors will support a trial, and any that won't is telling you something.
How should you operationalize it?#
Keep the stack boring:
- One source of truth. Pick the CRM as the master record and let enrichment write into it. Parallel spreadsheets diverge within a month.
- Timestamp every enriched field.
employee_count_updated_atis the difference between a refresh policy and a guess. - Normalize before you segment. "Software", "SaaS", "Computer Software", and "Information Technology & Services" are the same bucket. Map them once, at ingest.
- Automate the refresh. A scheduled job through the Tomba API or a HubSpot integration beats a quarterly manual export that nobody runs after Q2.
- Measure fit against outcomes. Track win rate by firmographic band monthly. If a band underperforms for two consecutive quarters, cut it from the ICP rather than arguing about it.
The teams that get value from firmographic data aren't the ones with the biggest subscription. They're the ones with six clean fields, a refresh schedule, and a verification step before every send. That's a process problem, not a procurement problem — and it's cheaper to fix than a new contract.
Ready to turn your firmographic list into real contacts?#
Once your ICP filter is defined, the bottleneck moves from which companies to which people, and can you actually reach them. The Tomba Email Finder resolves named contacts at any qualified domain and verifies deliverability before the address enters your sequence — with 25 free searches a month to test the accuracy against your own segment, and Tomba pricing starting at $49/mo when you're ready to scale. Run your next 200-account list through it and compare the bounce rate against whatever you're using now.
Related guides#
Ready to find emails that actually work?
Join 150,000+ professionals who stopped guessing and started sending. Free credits on signup — no credit card required.
Get the Tomba newsletter
Practical outbound tactics and product updates — once every two weeks.
About the author