GTM Performance in 2026: Metrics, Benchmarks and Fixes
Most go-to-market teams measure activity, not performance. Here is the metric stack, benchmark table, and diagnostic sequence that separates a GTM engine that compounds from one that just burns pipeline.
TL;DR
- GTM performance is not "how much did we do" — it is revenue produced per unit of cost, capacity, and time. Activity dashboards hide the number that matters.
- Four metrics predict almost everything: pipeline coverage, win rate by segment, CAC payback, and net revenue retention. Everything else is a leading indicator of one of those.
- The single most common cause of bad GTM performance is not effort — it is bad contact data feeding good process. Bounce rates above 5% quietly halve your effective rep capacity.
- Benchmark before you re-org. A 3.2x coverage ratio with a 22% win rate is a healthy machine; a 6x ratio with a 9% win rate is an expensive one.
- Fix in this order: data quality → ICP definition → channel mix → headcount. Adding reps to a broken funnel multiplies the breakage.
What is GTM performance, actually?#
GTM performance is the efficiency with which your go-to-market motion converts spend and rep-hours into recurring revenue. That's it. It is not lead volume, not meetings booked, not sequences sent.
Think of it like fuel economy in a car. Your marketing spend, rep salaries, and tooling budget are the fuel. Closed-won ARR is the distance travelled. Two companies can burn identical fuel and travel wildly different distances — and the one with better mileage wins even with a smaller tank.
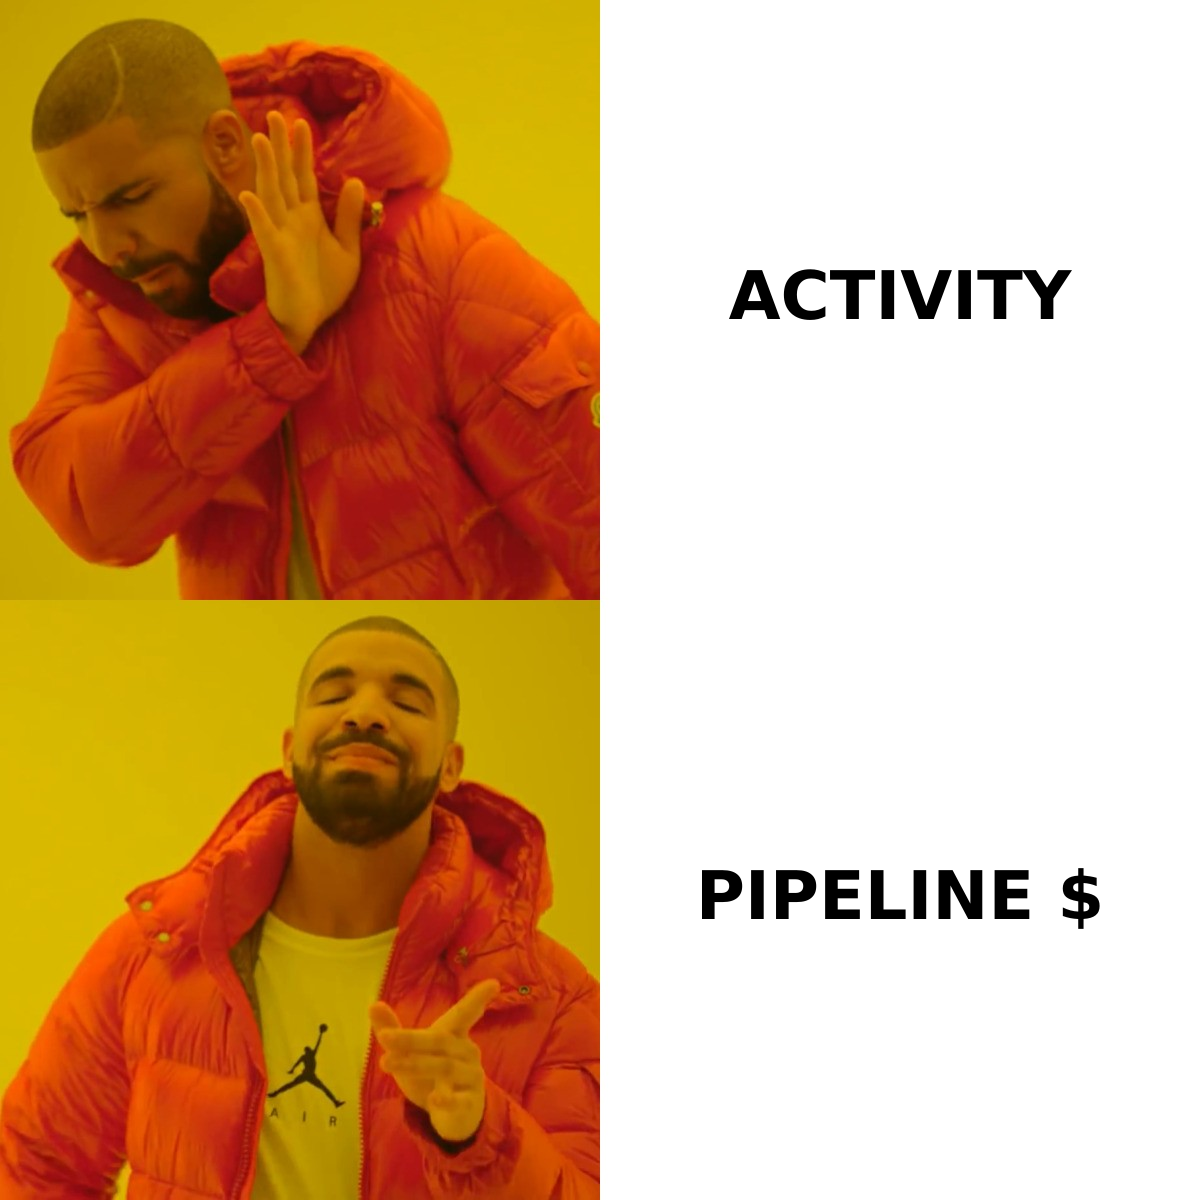
Most teams measure fuel consumption obsessively (activity metrics: calls, emails, demos) and measure distance vaguely (revenue, once a quarter). That asymmetry is why GTM dashboards look busy and boards look unhappy.
A working definition for 2026:
- Efficiency — CAC payback period and magic number. How fast does a dollar of GTM spend return?
- Conversion — stage-to-stage rates from first touch to closed-won, segmented by ICP tier.
- Coverage — pipeline value against quota, weighted by realistic stage probabilities.
- Retention — net revenue retention, because acquisition performance is meaningless if the bucket leaks.
- Velocity — median days in each stage, which is the metric that tells you whether a "healthy" pipeline is actually moving.
- Capacity — ramped rep productivity vs. plan, the constraint that caps everything else.
Which GTM performance metrics actually predict revenue?#
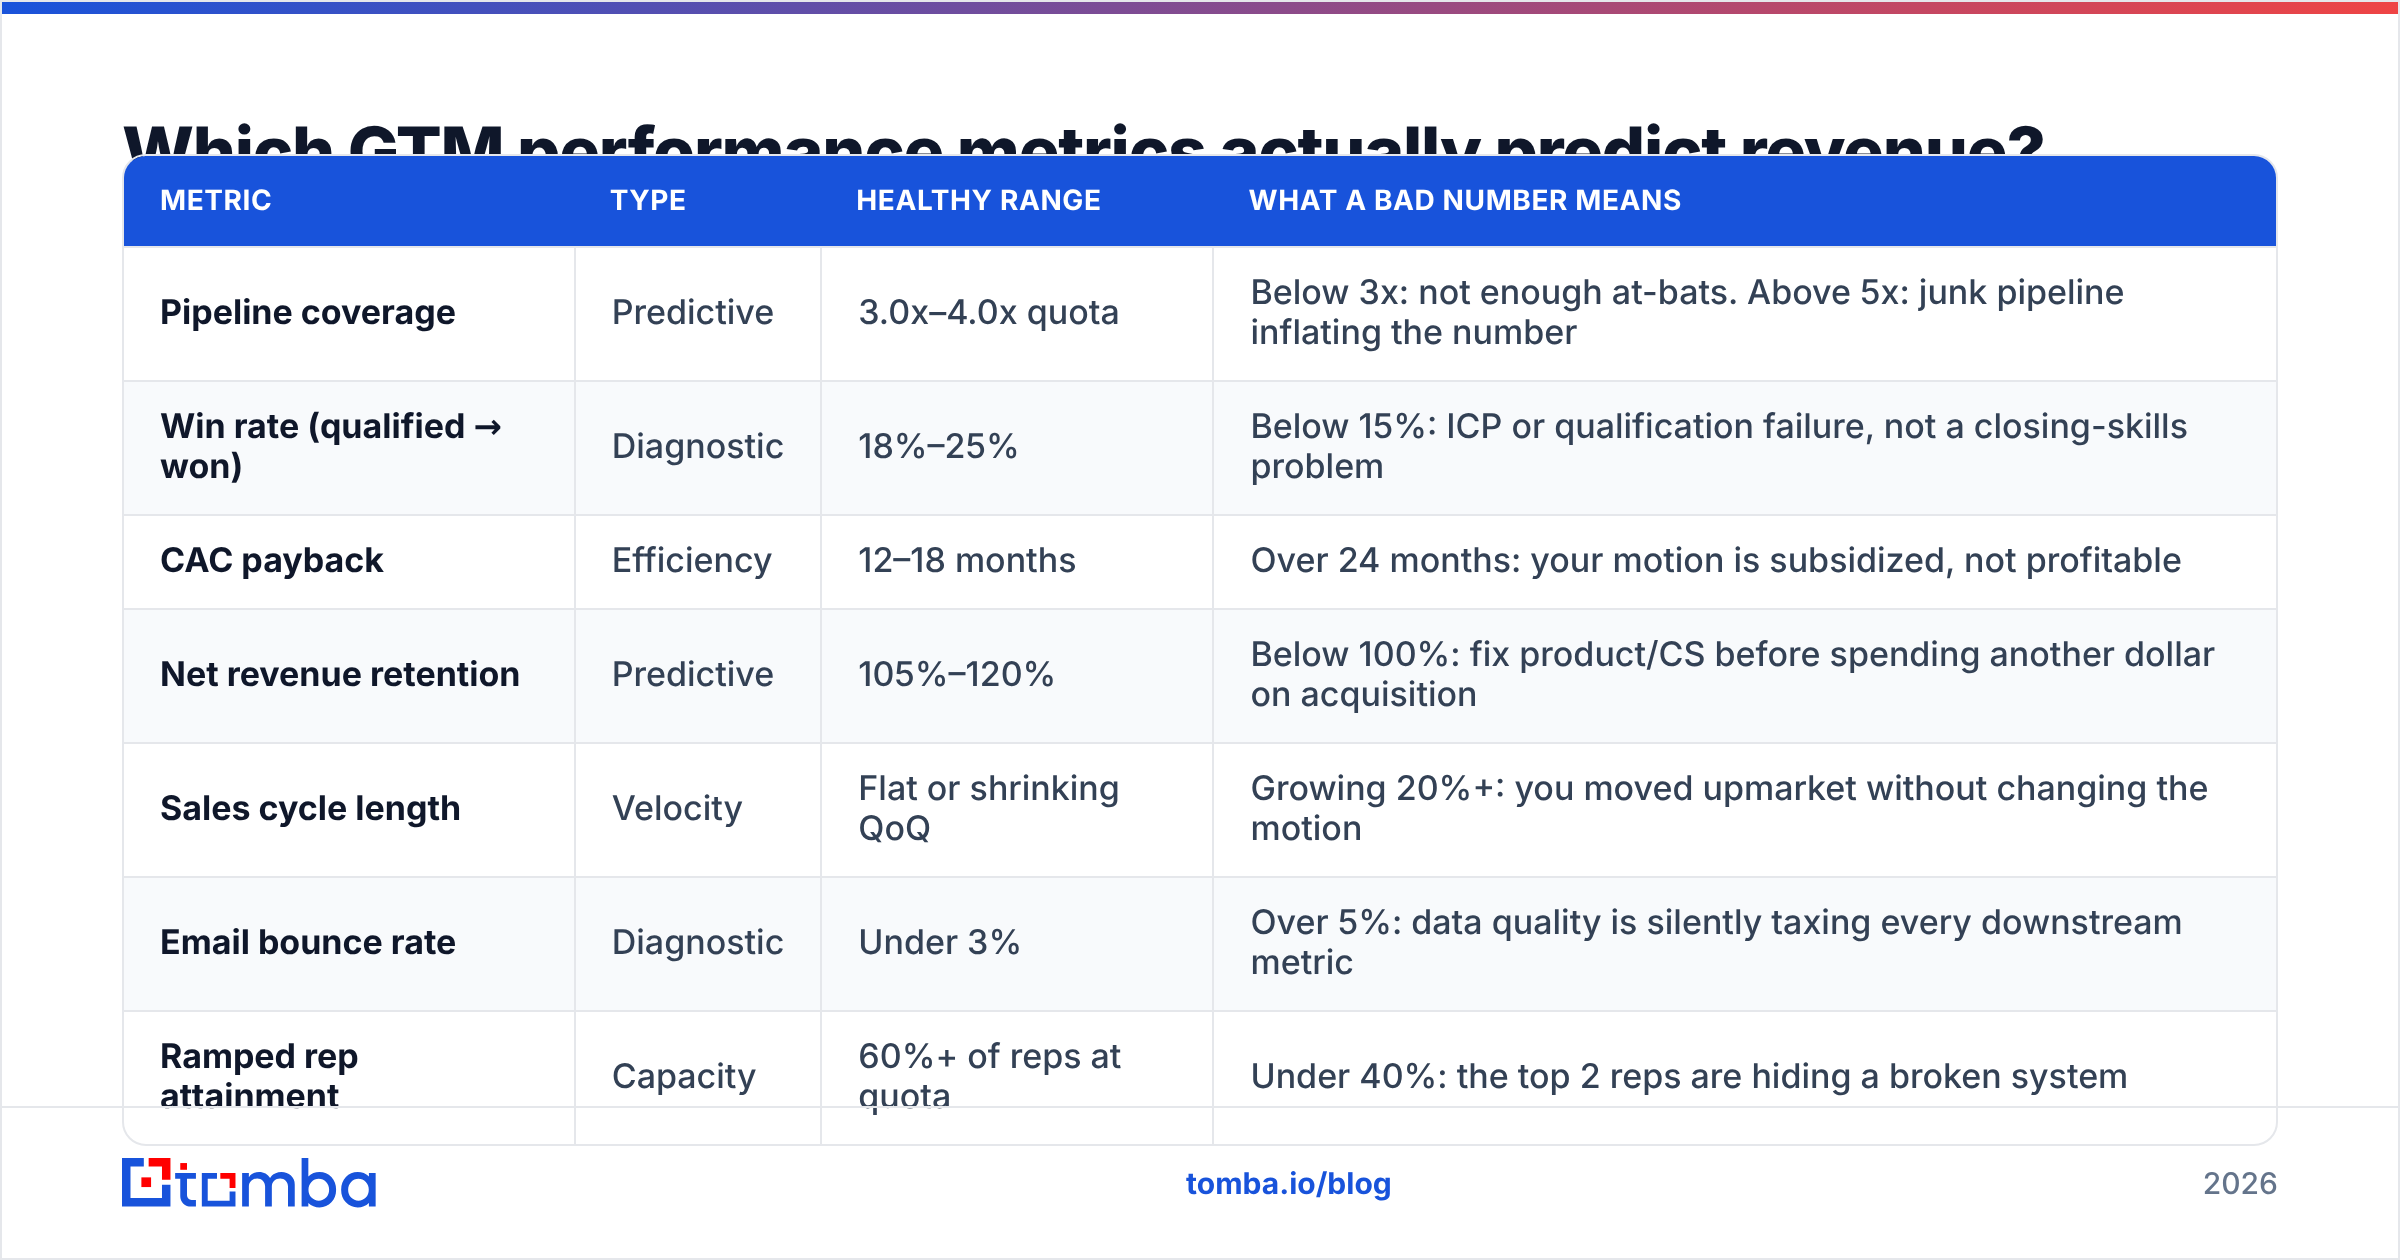
Not all metrics are equal. Some are diagnostic (they tell you what's broken), some are predictive (they tell you what's coming), and some are vanity (they tell you nothing but feel good in a board deck).
Here's the split, with realistic 2026 B2B SaaS ranges for mid-market motions:
| Metric | Type | Healthy range | What a bad number means |
|---|---|---|---|
| Pipeline coverage | Predictive | 3.0x–4.0x quota | Below 3x: not enough at-bats. Above 5x: junk pipeline inflating the number |
| Win rate (qualified → won) | Diagnostic | 18%–25% | Below 15%: ICP or qualification failure, not a closing-skills problem |
| CAC payback | Efficiency | 12–18 months | Over 24 months: your motion is subsidized, not profitable |
| Net revenue retention | Predictive | 105%–120% | Below 100%: fix product/CS before spending another dollar on acquisition |
| Sales cycle length | Velocity | Flat or shrinking QoQ | Growing 20%+: you moved upmarket without changing the motion |
| Email bounce rate | Diagnostic | Under 3% | Over 5%: data quality is silently taxing every downstream metric |
| Ramped rep attainment | Capacity | 60%+ of reps at quota | Under 40%: the top 2 reps are hiding a broken system |
| Meetings held → opportunity | Diagnostic | 45%–60% | Below 35%: you're booking the wrong people, not too few |
The two rows people skip are bounce rate and ramped rep attainment. Both are unglamorous, and both are load-bearing.
If 60% of your reps miss quota, you don't have a coaching problem — you have a system that only works for outliers. And if your bounce rate sits at 8%, every downstream conversion rate you report is computed on a denominator that includes contacts who never existed. Your email verifier step is not a hygiene nicety; it is the thing that makes your funnel math honest.
How do you benchmark your GTM performance against peers?#
Benchmark carefully. Most public GTM benchmarks blend seed-stage startups with $200M ARR companies, and the resulting median describes nobody.
Three rules for useful benchmarking:
Segment by ACV band first. A $5K ACV motion and a $150K ACV motion share almost no benchmarks. Win rates, cycle lengths, and touch counts differ by an order of magnitude. Compare yourself to your band, not to the industry average.
Benchmark trajectory, not level. Whether your win rate is 19% or 23% matters less than whether it's rising. A 19% win rate improving 2 points per quarter beats a 24% rate degrading 1 point per quarter, every time.
Use two independent sources. Peer-reported survey data from places like Gartner skews optimistic because underperformers don't respond. Cross-check against operational data from your own CRM, and against public disclosures where available. When two sources disagree by more than 30%, trust neither and instrument your own baseline.
For a broader vocabulary on the metrics above, Tomba's B2B glossary breaks down terms like win rate and revenue operations with the formulas attached.
Why does data quality dominate GTM performance?#
Because every other lever is multiplied by it.
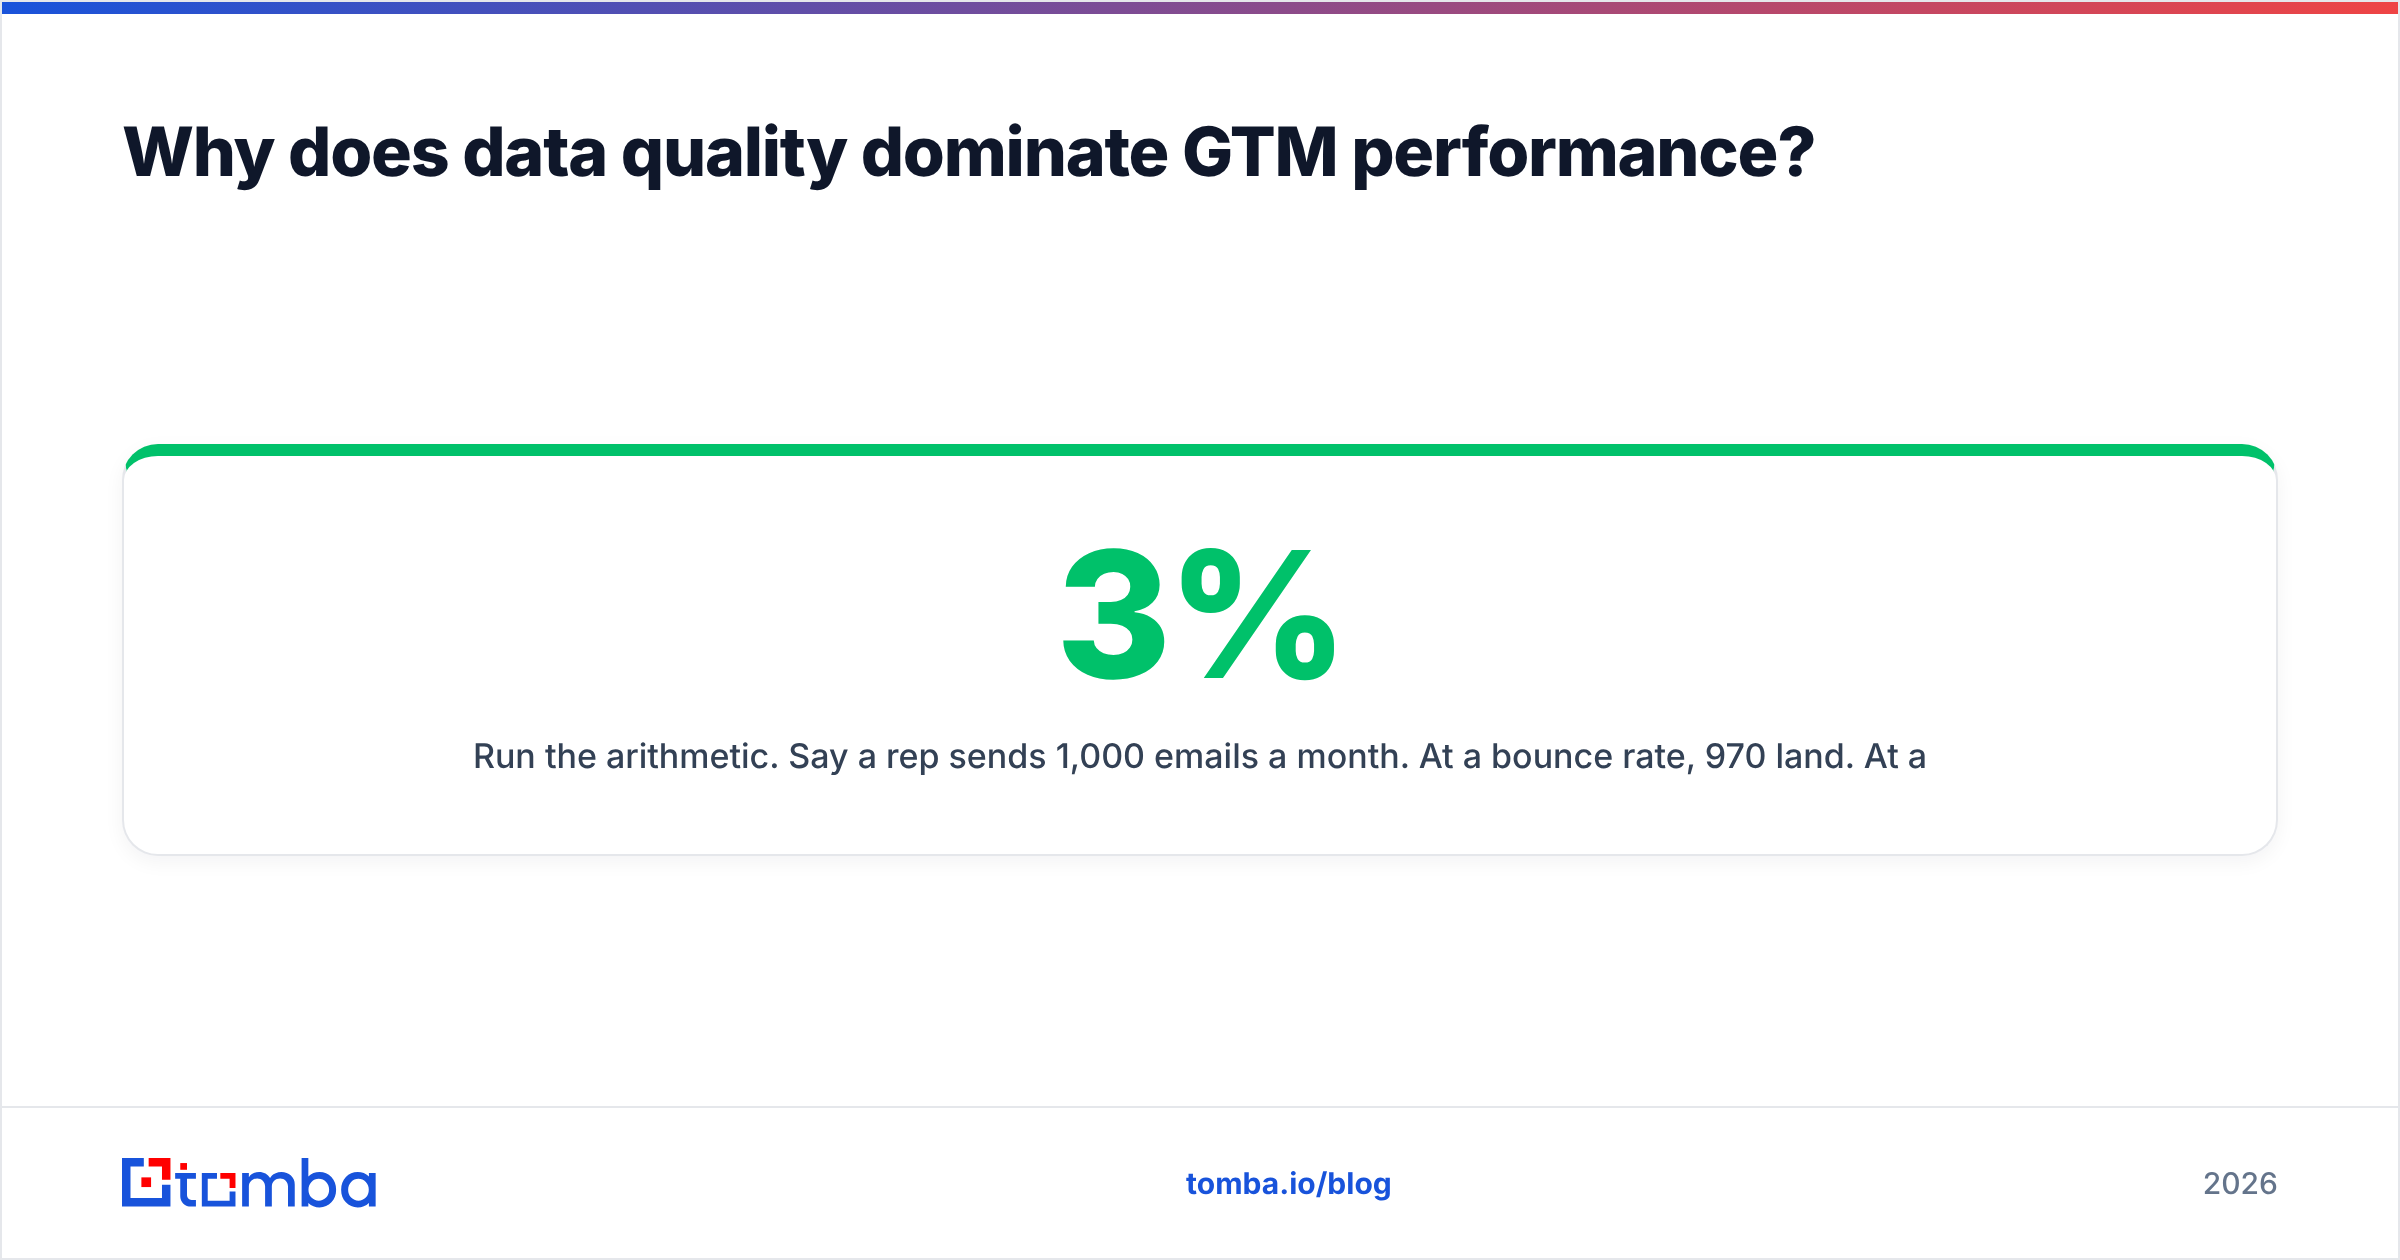
Run the arithmetic. Say a rep sends 1,000 emails a month. At a 3% bounce rate, 970 land. At a 12% bounce rate, 880 land — but that's not the real damage. The real damage is that mailbox providers read bounce rate as a spam signal, so your inbox placement on the remaining 880 drops too. A 12% bounce rate doesn't cost you 9% of your volume; it can cost you 30–40% of your effective reach once sender reputation degrades.
Now multiply that across a 10-rep team, then compound it over two quarters of reputation decay. That is a headcount's worth of output, lost to a data problem that costs a few hundred dollars a month to fix.
The failure pattern looks like this:
- Stale contacts enter the CRM from a list purchase, an old export, or a scraped source with no verification layer.
- Reps work them anyway because the CRM says they're valid and nobody audits.
- Bounces accumulate and domain reputation drops below the threshold where Gmail and Outlook route to spam.
- Reply rates fall across all campaigns, including the ones with clean data.
- Leadership responds by adding activity quotas, which increases send volume against a degraded domain and accelerates the decline.
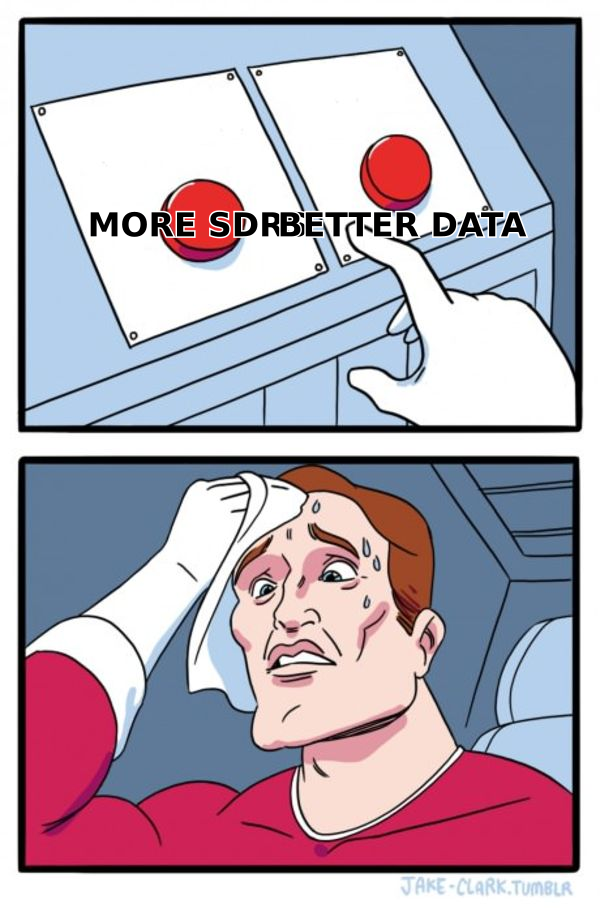
Step five is where most GTM teams are. The instinct to "do more" is exactly wrong when the constraint is data integrity.
Fixing it is mechanical, not strategic: verify on entry, re-verify anything older than 90 days, and route catch-all domains to a separate validation path. A catch-all verifier matters more than people expect — catch-all domains accept everything at the SMTP handshake and then silently discard, so they pass naive validation and still poison your metrics.
How do the main GTM data platforms compare?#
Your GTM performance depends heavily on where contact data enters the system. The market splits into three rough categories: all-in-one sales platforms, verified-list providers, and API-first data infrastructure.
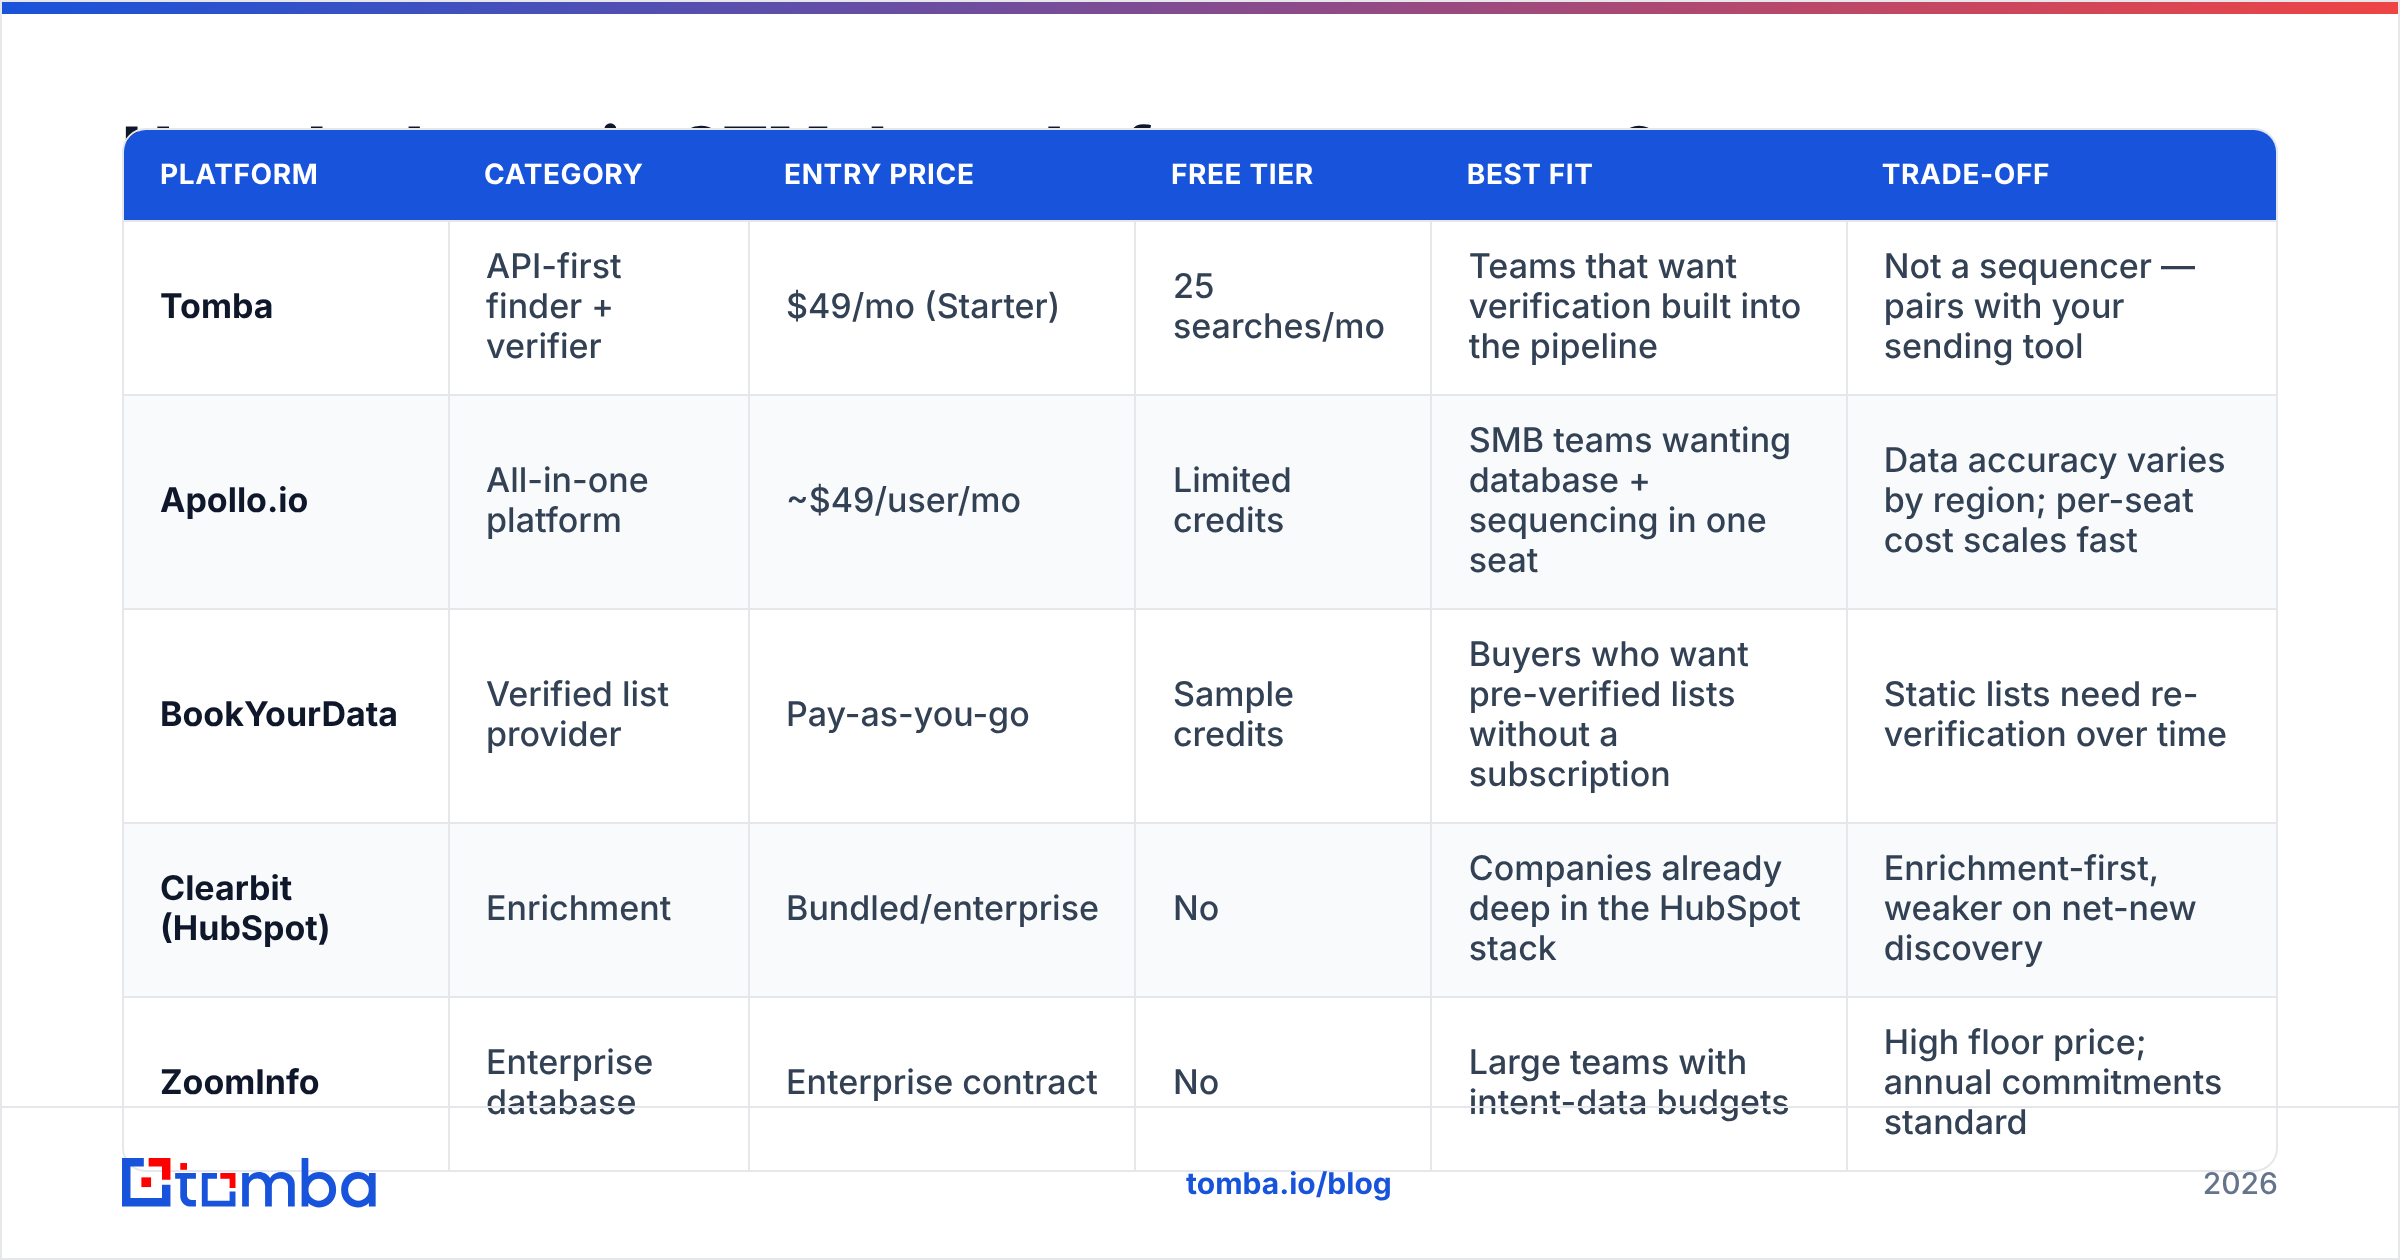
| Platform | Category | Entry price | Free tier | Best fit | Trade-off |
|---|---|---|---|---|---|
| Tomba | API-first finder + verifier | $49/mo (Starter) | 25 searches/mo | Teams that want verification built into the pipeline | Not a sequencer — pairs with your sending tool |
| Apollo.io | All-in-one platform | ~$49/user/mo | Limited credits | SMB teams wanting database + sequencing in one seat | Data accuracy varies by region; per-seat cost scales fast |
| BookYourData | Verified list provider | Pay-as-you-go | Sample credits | Buyers who want pre-verified lists without a subscription | Static lists need re-verification over time |
| Clearbit (HubSpot) | Enrichment | Bundled/enterprise | No | Companies already deep in the HubSpot stack | Enrichment-first, weaker on net-new discovery |
| ZoomInfo | Enterprise database | Enterprise contract | No | Large teams with intent-data budgets | High floor price; annual commitments standard |
The strategic question isn't "which has the most contacts." Every vendor claims hundreds of millions of records. The question is which one gives you a verified, current record for the specific accounts in your ICP — a 5,000-contact list where 97% land beats a 50,000-contact list where 78% land, both in output and in domain safety.
If you're evaluating swaps, Tomba maintains direct comparisons for the common cases: Apollo alternative, Clearbit alternative, and ZeroBounce alternative pages lay out the feature-by-feature deltas without the marketing gloss. For third-party sentiment, G2's sales intelligence category aggregates enough reviews to spot the patterns vendors don't advertise.
What is the right diagnostic sequence when GTM performance drops?#
Work outside-in. Most teams start with the sales team because that's where the number is visible, which is like blaming the last domino.
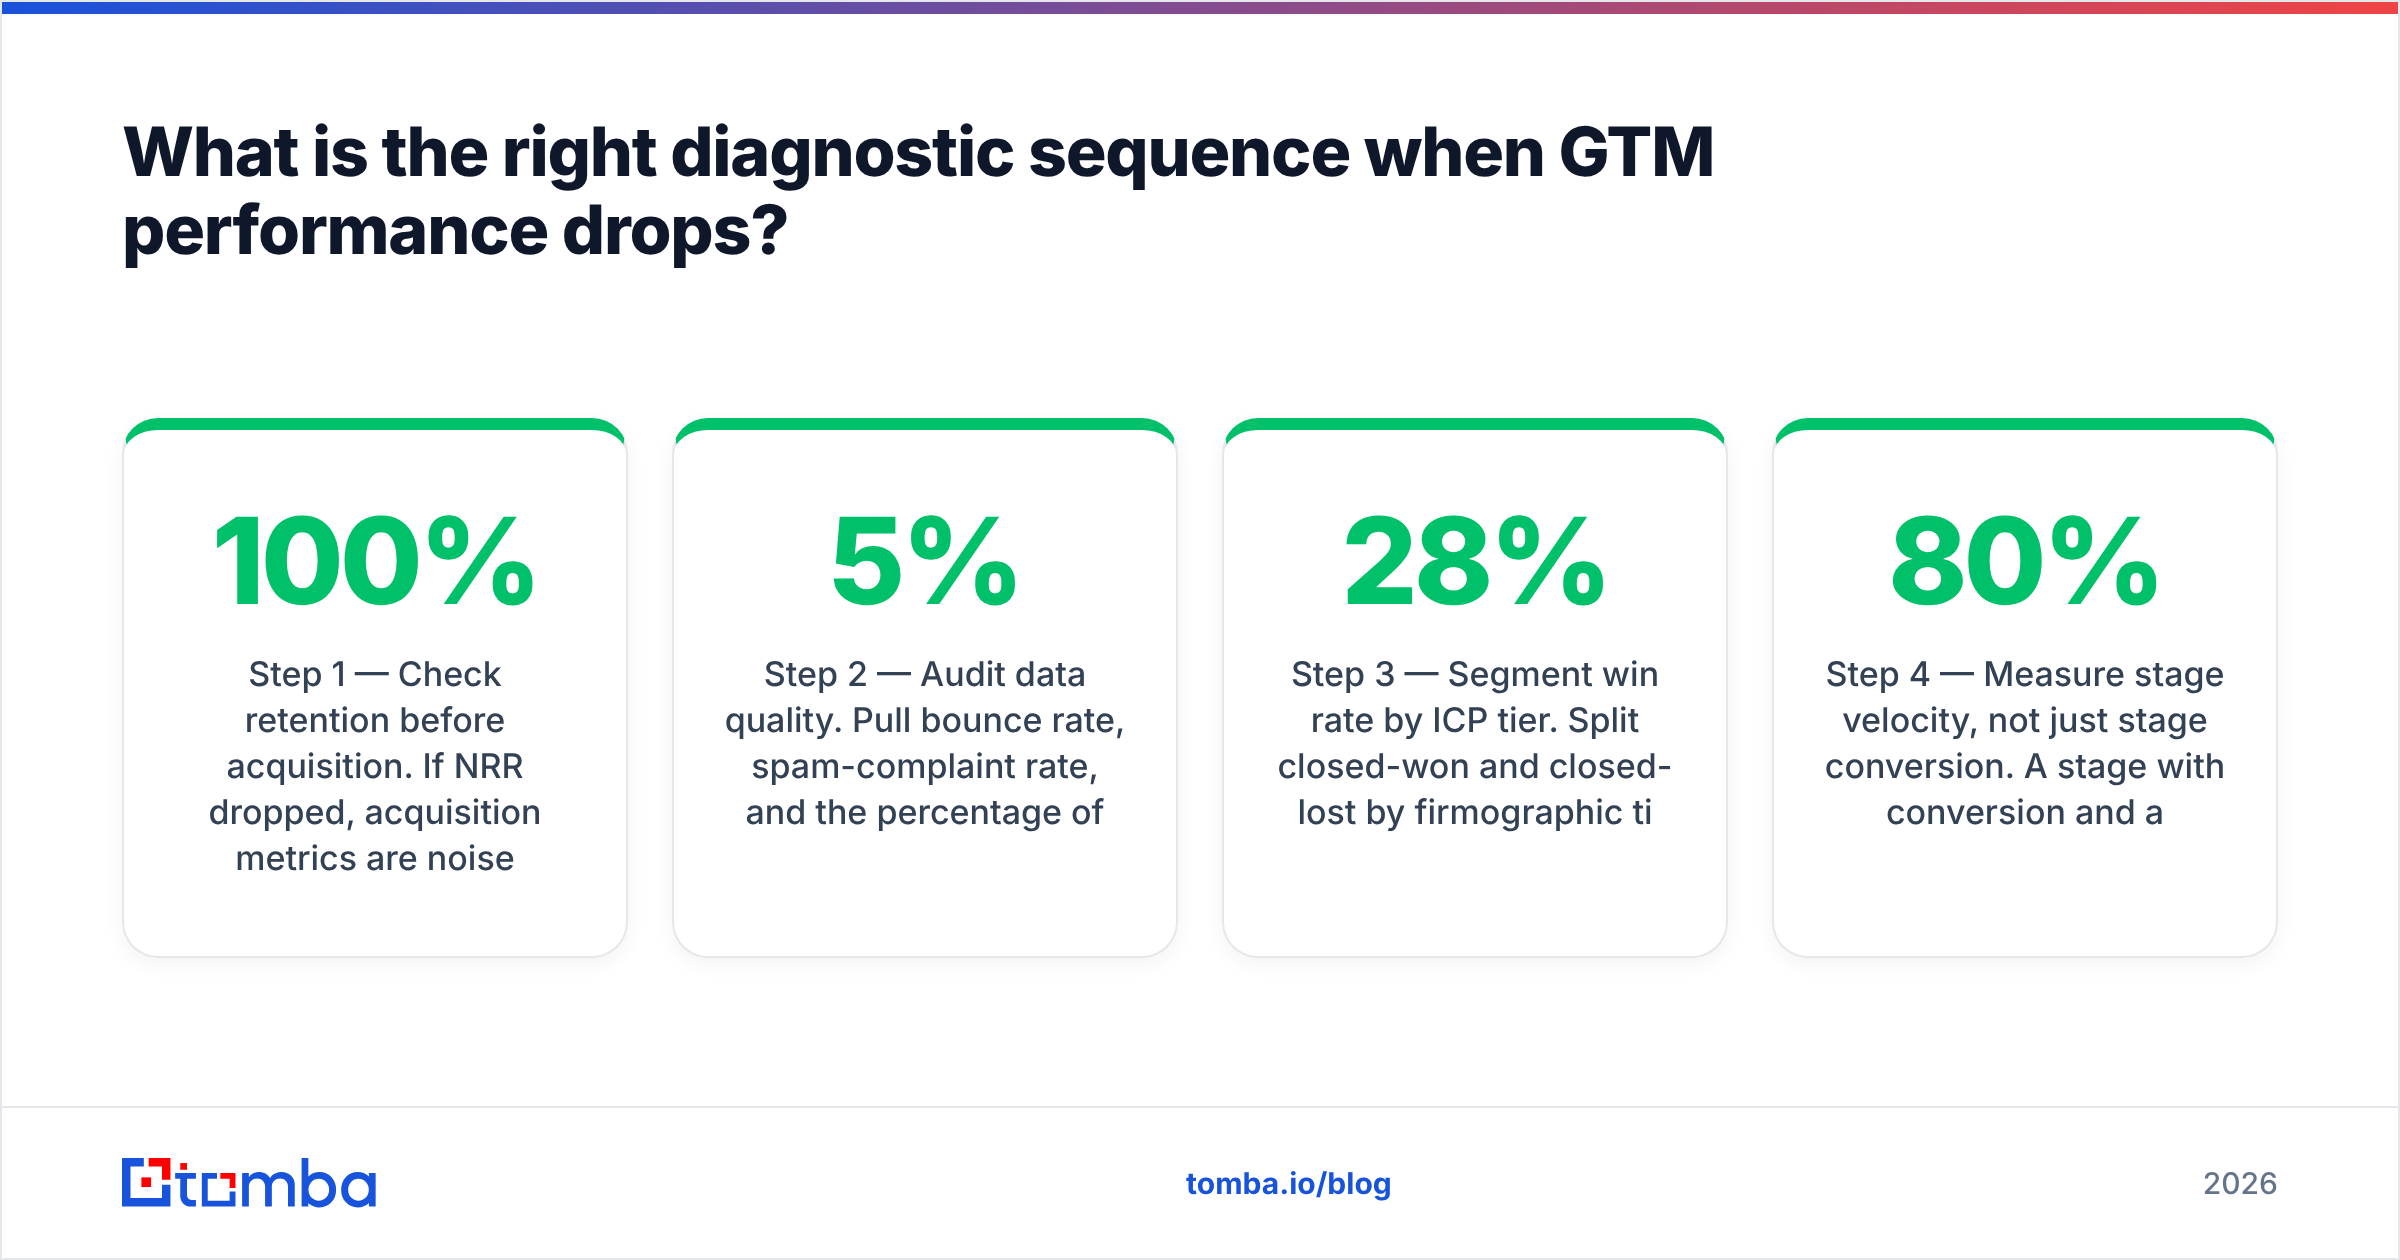
Step 1 — Check retention before acquisition. If NRR dropped, acquisition metrics are noise. You are filling a leaking bucket faster. Fix churn drivers first; the GTM math doesn't work at sub-100% NRR regardless of how good your top of funnel is.
Step 2 — Audit data quality. Pull bounce rate, spam-complaint rate, and the percentage of CRM contacts older than 12 months. If bounce is above 5% or stale contacts exceed 40%, stop the diagnosis here and fix this. Nothing downstream is measurable until it's clean.
Step 3 — Segment win rate by ICP tier. Split closed-won and closed-lost by firmographic tier. If tier-1 accounts convert at 28% and tier-3 at 6%, you don't have a win-rate problem — you have a targeting problem, and the fix is a narrower list, not more training.
Step 4 — Measure stage velocity, not just stage conversion. A stage with 80% conversion and a 45-day median dwell time is worse than one with 60% conversion and 8 days. Slow stages consume rep capacity that never shows up on a conversion chart.
Step 5 — Only then look at rep performance. With clean data, a defined ICP, and known velocity, individual variance becomes interpretable. Before that, you're evaluating people on a system's failures.
Step 6 — Re-check channel mix against CAC payback. Rank channels by payback period, not by lead volume. The channel producing the most MQLs is frequently the one with the worst payback, and the MQL count is what makes that invisible.
How do you build a GTM performance dashboard that people actually use?#
Three panels. Not thirty widgets.
Panel one: the efficiency number. CAC payback and magic number, trended over the last six quarters. One chart. This is the board-level answer to "is the machine working."
Panel two: the constraint. Whatever is currently the bottleneck — coverage in one quarter, win rate in another, ramp time in a third. It changes, and the dashboard should change with it. A fixed dashboard measures last year's problem.
Panel three: the leading indicator. Something that moves 30–60 days before revenue does. For most B2B motions that's qualified meetings held, weighted by ICP tier. Not meetings booked — booked-vs-held gaps of 25%+ are common and hide real decay.
Everything else lives in a drill-down that three people open. That's fine. Dashboards that try to serve everyone serve nobody, and the RevOps team spends more time maintaining them than acting on them. HubSpot's sales reporting documentation is a reasonable reference for wiring the underlying report objects if you're on that stack.
One practical note on instrumentation: attribution breaks the moment your contact records are duplicated or malformed. Deduplicate before you attribute. Running a pass with a bulk email finder and dedupe step before the quarter closes usually surfaces 5–15% duplicate rate in CRMs that haven't been audited in a year, which distorts every per-account metric on the dashboard.
What changes about GTM performance in 2026?#
Three shifts are worth planning around.
Inbox filtering got stricter, and it's still tightening. Google and Yahoo's bulk-sender requirements moved from guidance to enforcement, and the practical effect is that a domain with a poor complaint history has no volume path back. Warmup helps, but warmup on a bad list is just a slower way to burn a domain. Verification at the point of entry is now table stakes, not optimization.
AI-generated outbound collapsed baseline reply rates. When every prospect gets forty personalized-sounding emails a week, generic personalization is worth roughly zero. The teams whose GTM performance improved in 2026 mostly cut volume and raised list precision. Fewer, better-targeted sends against verified contacts beat spray at every ACV band we've seen data for.
Buying committees expanded again. Median committee size for mid-market B2B keeps creeping up, which means multi-threading is no longer a best practice but a requirement. That has a direct data implication: you need 4–6 verified contacts per target account, not one. Single-threaded accounts stall at the same rate they always did; the difference is that the stall now happens later, after you've spent the cycle cost.
The through-line across all three: GTM performance in 2026 is gated by contact data precision more than by rep effort or tooling sophistication. The teams that internalized that are the ones whose CAC payback shortened while everyone else's stretched.
Where should you start?#
Pick the cheapest fix with the highest multiplier: clean your contact data before you change anything structural.
Run your existing CRM list through verification, measure the bounce rate you actually have (not the one you assume), and re-baseline your conversion metrics on the clean denominator. Most teams find that their "win rate problem" was partly a data problem, and that the corrected numbers point somewhere entirely different than the re-org they were planning.
When you need net-new contacts to fill the corrected pipeline, start with the Tomba Email Finder — it returns verified professional emails by domain, name, or company, with the verification step built in rather than bolted on afterward. The free tier gives you 25 searches a month to test accuracy against accounts you already know, and Tomba pricing starts at $49/mo for Starter if the sample checks out. Test it on 50 contacts you can independently verify before you commit a single list-building dollar. That's the whole method: measure the input quality first, then scale the motion.
Related guides#
Ready to find emails that actually work?
Join 150,000+ professionals who stopped guessing and started sending. Free credits on signup — no credit card required.
Get the Tomba newsletter
Practical outbound tactics and product updates — once every two weeks.
About the author