How to Calculate Cost Per Lead (Formula, Benchmarks, Fixes)
Most teams calculate cost per lead wrong by leaving out headcount, tooling, and bad data waste. Here is the full formula, 2026 benchmarks by channel, and the fastest levers to cut CPL without cutting volume.
TL;DR
- Cost per lead (CPL) = total lead-generation spend ÷ number of qualified leads generated in the same period. The argument is never about the division — it is about what you put in the numerator and what counts as a "lead."
- Most reported CPL numbers are 30-60% too low because they exclude salaries, tooling, agency retainers, content production, and the cost of leads that bounce or were never real.
- Track CPL at three levels: raw CPL, marketing-qualified CPL, and cost per sales-accepted lead. Only the third one predicts pipeline.
- Blended CPL hides everything. Segment by channel, segment, and campaign or you will keep funding the channel that looks cheap and converts at nothing.
- The fastest CPL reduction lever for most outbound teams is not cheaper ads — it is cutting the waste from unverified contact data before it enters the funnel.
What is cost per lead and why does the definition matter?#
Cost per lead is the average amount you spend to acquire one lead. The formula fits on a napkin:
Cost Per Lead = Total Lead Generation Spend ÷ Total Leads GeneratedSpend $20,000 in a month and generate 400 leads, and your CPL is $50. Done.
Except it almost never is. Two companies in the same category with identical bank statements can report CPLs of $18 and $71 because they disagree on two things: which costs belong in the numerator, and which contacts count as a lead in the denominator. If you cannot defend both definitions to your CFO in one sentence each, your CPL is a vanity metric.
The definition matters because CPL is a budgeting metric, not a scoreboard. You use it to answer: should I move $10,000 from paid search into outbound next quarter? That question only has a real answer if both channels are measured the same way.
How do you calculate cost per lead correctly?#
Start with the complete numerator. Here is what belongs in "total lead generation spend" for a given period:
- Direct media spend — Google Ads, LinkedIn Ads, paid sponsorships, review-site placements, event booth fees.
- Tooling and data — your email finder, verification credits, CRM seats attributable to demand gen, sequencing platform, enrichment vendors, intent data subscriptions.
- People cost — the fully loaded salary share of everyone who touches lead generation. An SDR who spends 100% of their time prospecting is 100% in. A content marketer who spends 40% of their time on lead magnets is 40% in.
- Content and creative production — freelancers, design, video, landing page development, agency retainers.
- Overhead allocation — optional but defensible: a proportional share of software, management, and admin overhead.
Now the denominator. Pick one definition and hold it constant:
- Raw leads — anyone who submitted a form, replied, or was added as a contact. Easiest to inflate, least useful.
- Marketing-qualified leads — leads that meet your fit and behavior threshold. See the definition of a marketing qualified lead if your team still argues about the line.
- Sales-accepted leads — leads a rep looked at and agreed to work. The number that actually forecasts pipeline.
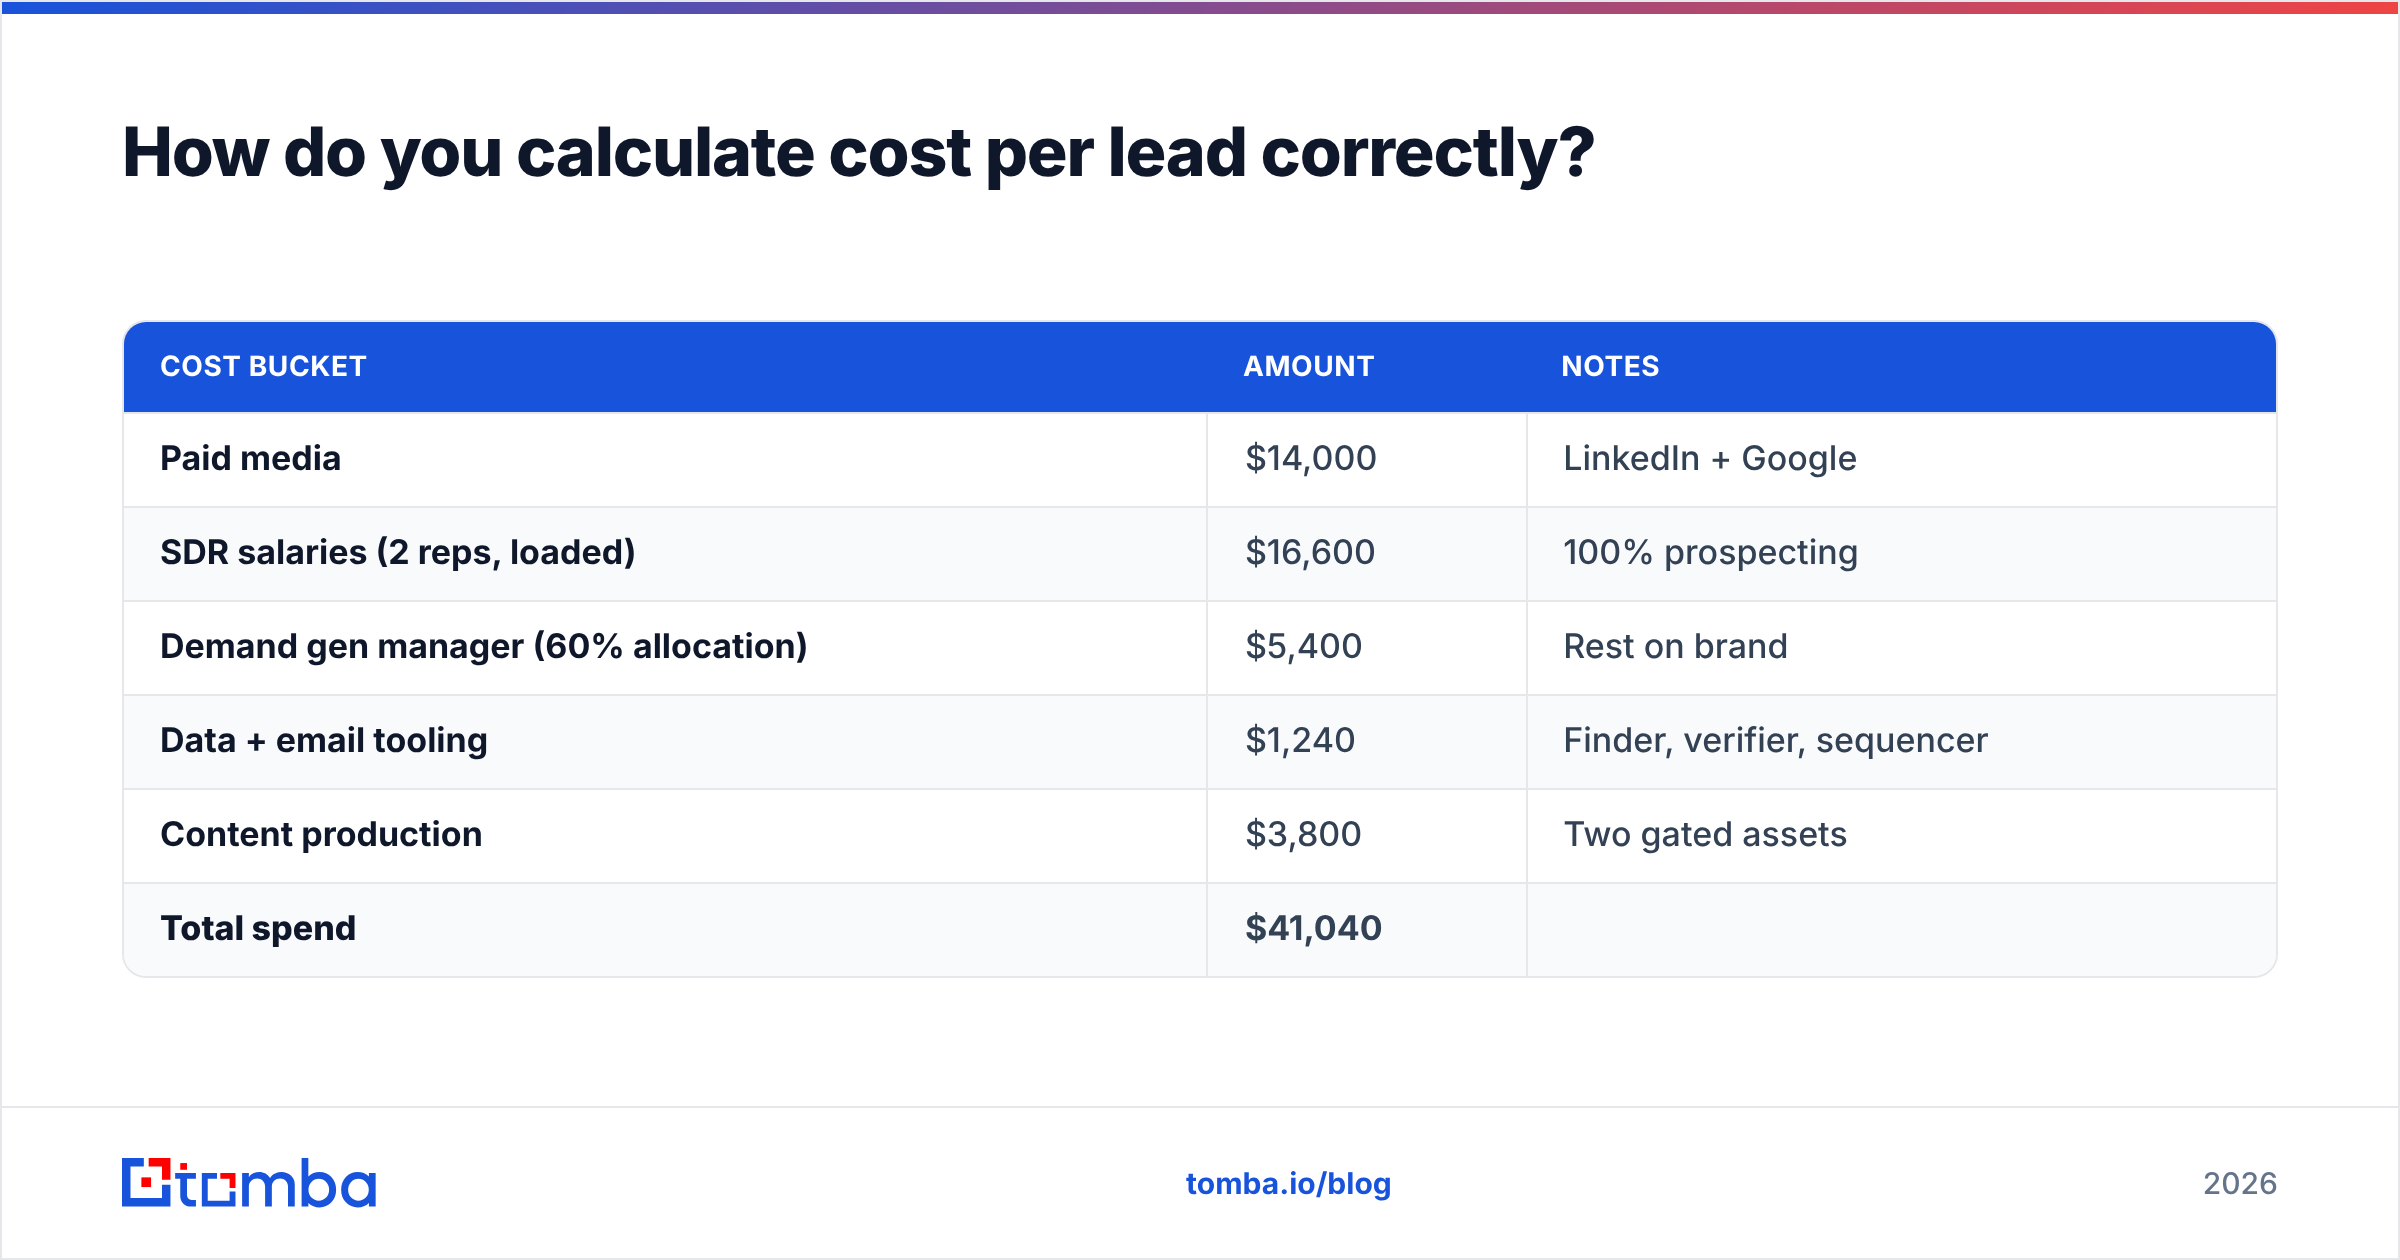
A worked example. A 12-person B2B SaaS team, one month:
| Cost bucket | Amount | Notes |
|---|---|---|
| Paid media | $14,000 | LinkedIn + Google |
| SDR salaries (2 reps, loaded) | $16,600 | 100% prospecting |
| Demand gen manager (60% allocation) | $5,400 | Rest on brand |
| Data + email tooling | $1,240 | Finder, verifier, sequencer |
| Content production | $3,800 | Two gated assets |
| Total spend | $41,040 |
That month produced 620 raw leads, 340 MQLs, and 190 sales-accepted leads.
- Raw CPL: $41,040 ÷ 620 = $66.19
- MQL CPL: $41,040 ÷ 340 = $120.71
- Sales-accepted CPL: $41,040 ÷ 190 = $216.00
All three are correct. Only the third one tells you what a workable conversation costs. If the team reports $66 to the board and the CFO models pipeline off it, everyone is going to be unpleasantly surprised in Q3.
What is a good cost per lead in 2026?#
There is no universal good number — CPL scales with deal size and sales cycle. A $2,000 ACV product cannot survive a $400 CPL. A $180,000 enterprise contract can absorb a $1,200 CPL comfortably.
The useful benchmark is CPL as a fraction of customer acquisition cost, and CAC as a fraction of lifetime value. If your lead-to-customer rate is 4% and your CPL is $120, your CAC from that channel is $3,000 before sales cost. Compare that to ACV, not to a competitor's blog post.
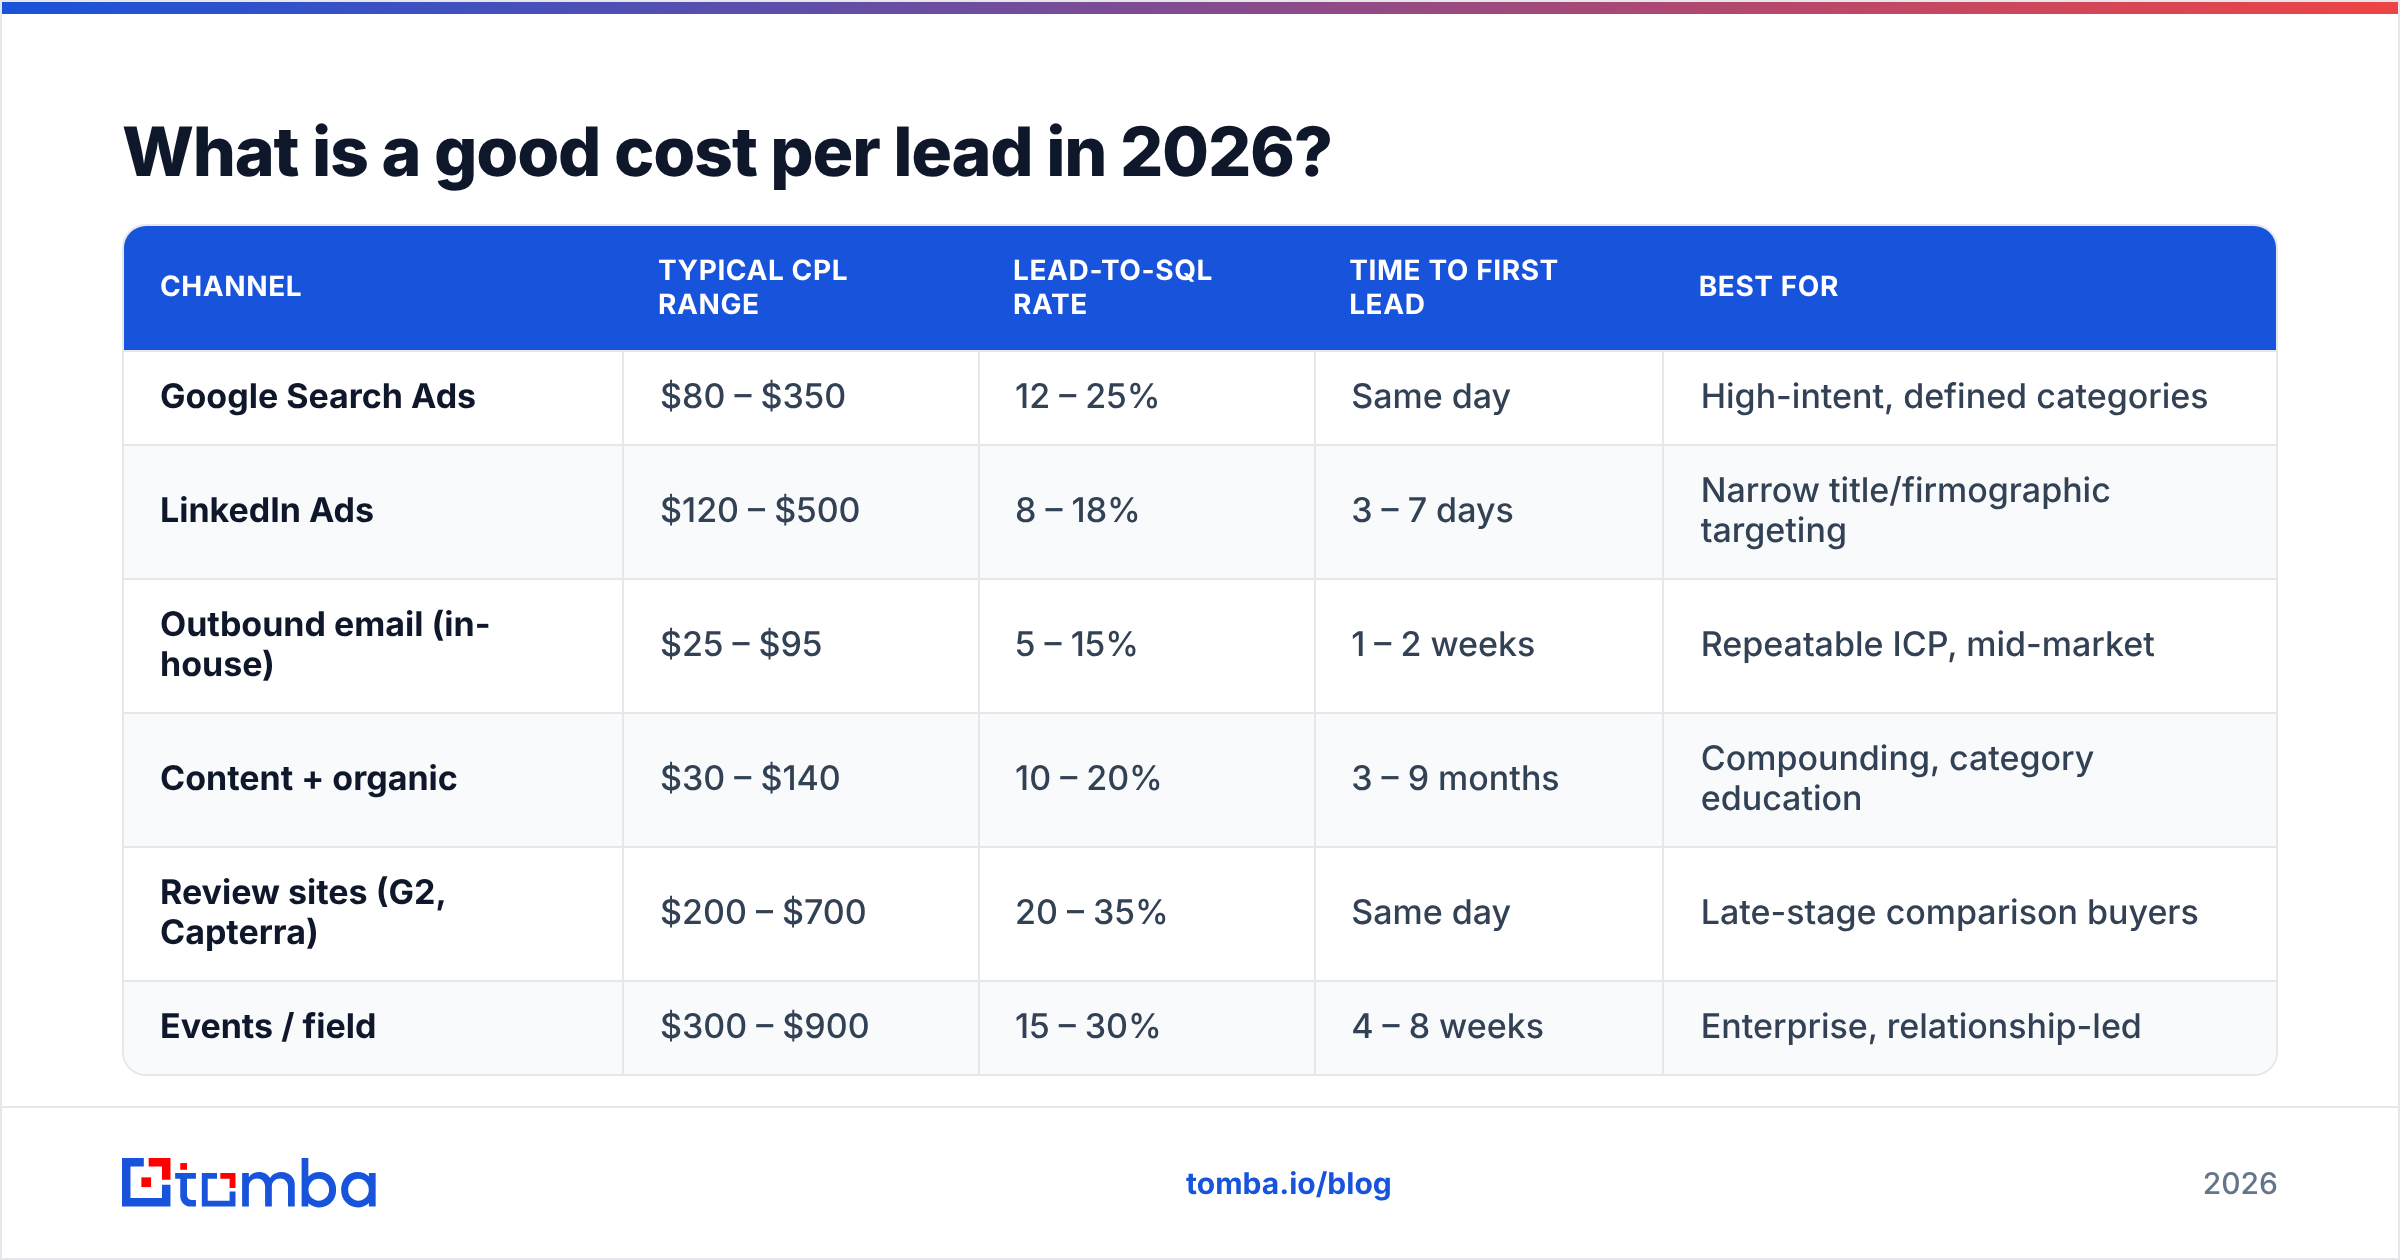
That said, here are the ranges most B2B teams land in by channel:
| Channel | Typical CPL range | Lead-to-SQL rate | Time to first lead | Best for |
|---|---|---|---|---|
| Google Search Ads | $80 – $350 | 12 – 25% | Same day | High-intent, defined categories |
| LinkedIn Ads | $120 – $500 | 8 – 18% | 3 – 7 days | Narrow title/firmographic targeting |
| Outbound email (in-house) | $25 – $95 | 5 – 15% | 1 – 2 weeks | Repeatable ICP, mid-market |
| Content + organic | $30 – $140 | 10 – 20% | 3 – 9 months | Compounding, category education |
| Review sites (G2, Capterra) | $200 – $700 | 20 – 35% | Same day | Late-stage comparison buyers |
| Events / field | $300 – $900 | 15 – 30% | 4 – 8 weeks | Enterprise, relationship-led |
Two caveats. First, organic content CPL looks unbeatable only if you amortize production cost over the asset's full life — do that honestly or not at all. Second, the review-site numbers assume you are actually converting; G2 traffic is expensive and high-intent, which is a good trade until your sales team stops following up within an hour.
Why is your reported cost per lead lower than reality?#
Five things get quietly excluded, and each one drags your number down:
- Salaries. The single biggest omission. If two SDRs cost $16,600 a month and you only count the $1,240 tooling bill, your outbound CPL is off by more than 10x.
- Invalid contact data. Every bounced email, dead phone number, and role-changed contact was paid for. If 22% of your list is unusable, your effective CPL is your nominal CPL divided by 0.78.
- Lead recycling. The same contact enters through three campaigns and gets counted three times in the denominator. Deduplicate first — a remove duplicates pass before reporting is a five-minute fix.
- Deliverability drag. Leads you never reached because messages landed in spam still cost full price. Poor email deliverability inflates CPL without appearing anywhere in the spend line.
- Attribution lag. Long sales cycles mean this month's spend produces next quarter's leads. Comparing January spend to January leads flatters fast channels and punishes slow ones.
Fix these and your CPL number goes up. That is the point. A CPL you trust and dislike beats a CPL you like and cannot defend.
How do data quality and CPL connect?#
Directly and unforgivingly. Contact data sits upstream of every outbound cost you have, so its error rate multiplies through the whole funnel.
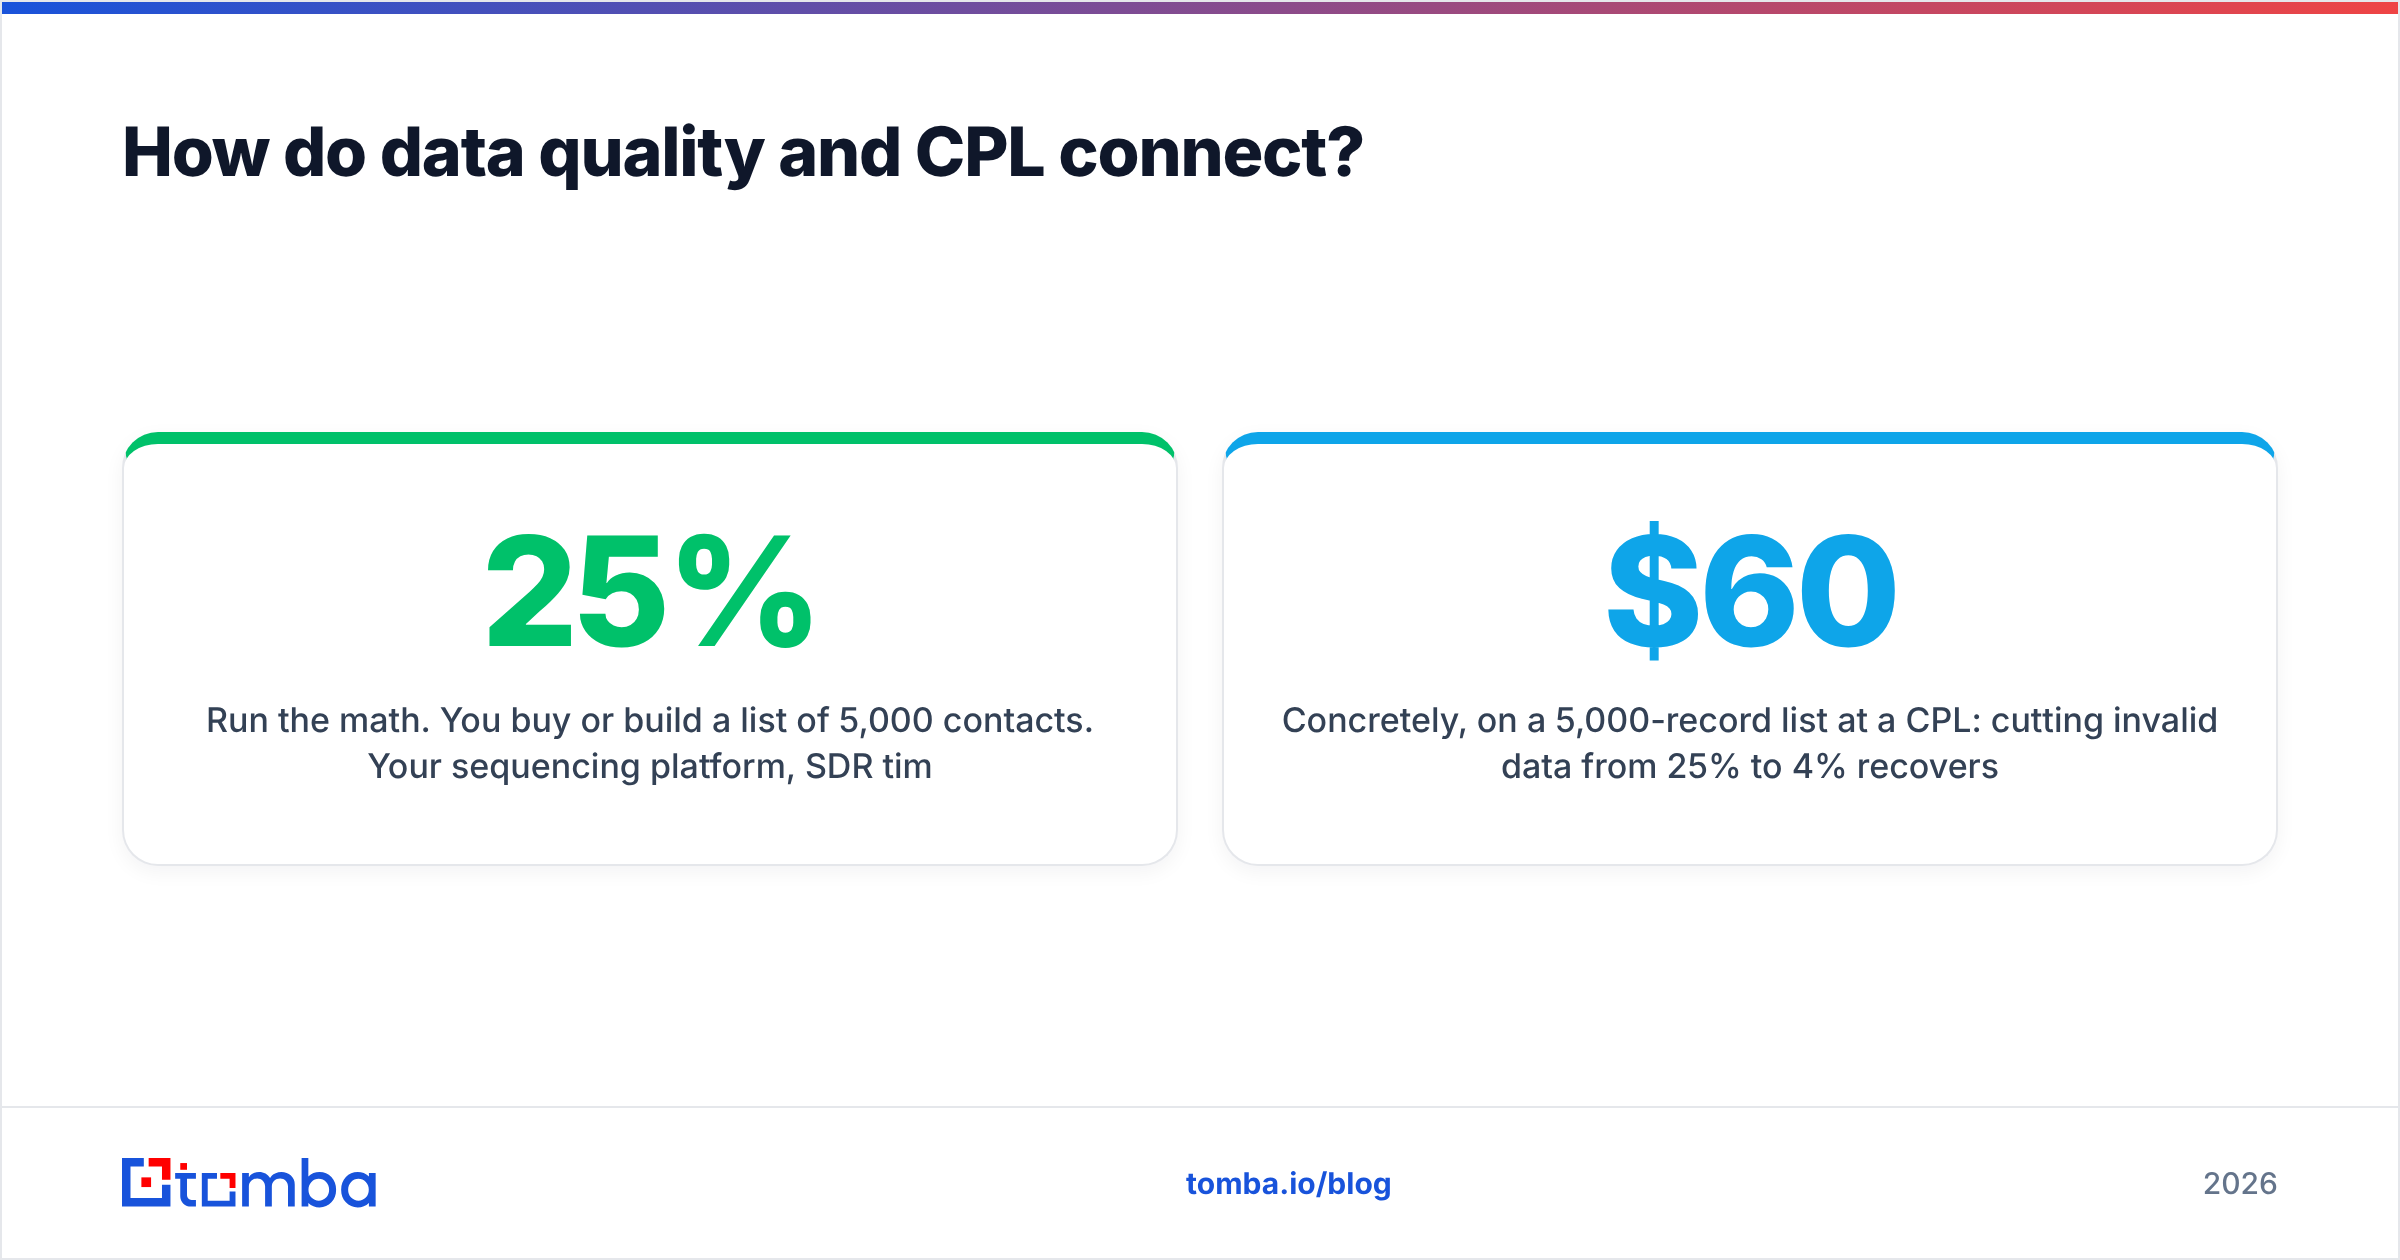
Run the math. You buy or build a list of 5,000 contacts. Your sequencing platform, SDR time, and domain reputation are all committed the moment you load it. If 25% of those addresses are invalid:
- 1,250 sends are wasted outright
- Your bounce rate spikes, which suppresses inbox placement for the remaining 3,750
- Your sender reputation degrades, raising the cost of every future campaign from that domain
The compounding part is what most teams miss. A bad list does not just waste its own budget — it taxes the next three campaigns too.
The counter-move is boring and effective: verify before you send. Running the list through an email verifier costs a fraction of a cent per record and removes the bounce risk entirely. For domains that accept everything, a dedicated catch-all verifier separates the genuinely valid from the merely unrejected. Sourcing addresses through a domain search that returns confidence scores beats scraping and hoping.
Concretely, on a 5,000-record list at a $60 CPL: cutting invalid data from 25% to 4% recovers roughly 1,050 usable contacts you already paid for. That is a 21% effective CPL reduction with zero additional media spend and no change to your messaging.

How do you segment CPL so it becomes actionable?#
Blended CPL is the metric equivalent of an average water temperature across a room with a fire in one corner. Break it apart along three axes:
- By channel — the baseline split. Paid, outbound, organic, referral, events. Never report a single company-wide number without this breakdown available.
- By ICP segment — enterprise leads cost 3-5x what SMB leads cost and are worth 10-20x more. A blended number makes enterprise look like a failure.
- By campaign and creative — within a channel, CPL variance between top and bottom performers is routinely 4x. That variance is where your budget reallocation lives.
- By stage — raw, MQL, SAL, opportunity. Watching CPL inflate across stages tells you exactly where qualification is leaking.
- By time cohort — spend in month N against leads attributed to month N spend, not leads that happened to arrive in month N.
Set the segmentation up once in your CRM and it runs itself. HubSpot's reporting documentation covers the attribution model configuration if you are on their stack; the concepts transfer to Salesforce and Pipedrive with different menu names.
The decision this unlocks: when you see LinkedIn Ads at a $180 MQL CPL and outbound at a $70 MQL CPL, but LinkedIn's SAL rate is 22% against outbound's 9%, the cost per sales-accepted lead is $818 versus $778. They are nearly identical, and the "obvious" reallocation you were about to make was wrong.
How do you actually reduce cost per lead?#
Ranked by effort-to-impact, highest first:
- Clean the data before it enters the funnel. Verification is the cheapest lever in the stack. Nothing else returns 15-25% effective CPL improvement for under $100.
- Kill your bottom-quartile campaigns. Within any channel, the worst 25% of campaigns typically consume 20% of budget and produce 5% of leads. Reallocating that is free money.
- Tighten ICP before you widen targeting. Broader targeting lowers raw CPL and raises sales-accepted CPL. Narrower targeting does the reverse. Optimize for the second number.
- Improve conversion rate, not just traffic cost. Landing page conversion going from 2.1% to 3.4% cuts CPL by 38% with identical spend. Usually cheaper than winning the auction.
- Extend content asset life. A guide that generates leads for 24 months instead of 6 has a quarter of the amortized CPL. Refresh beats rewrite.
- Consolidate tooling. Teams routinely pay for three overlapping data vendors. Audit the stack against actual usage — Tomba pricing starts at $49/mo for Starter, $99/mo for Growth, and $249/mo for Pro, and a free tier with 25 searches covers evaluation before you commit.
One thing not on this list: cutting SDR headcount to lower the numerator. It works arithmetically and destroys the denominator faster. CPL improvements that reduce lead volume are not improvements.
How does CPL relate to CAC and payback?#
CPL is one input to customer acquisition cost, not a substitute for it.
CAC = (Lead Gen Spend + Sales Spend) ÷ New Customers
CAC = CPL ÷ Lead-to-Customer Rate + Sales Cost per Customer
If your CPL is $120 and 5% of leads become customers, your marketing-side CAC is $2,400. Add the sales cost to close and you might land at $4,100. Against a $14,000 ACV with 3-year retention, that is healthy. Against a $6,000 ACV with 14-month churn, it is not.
Track these together on one line: CPL, lead-to-customer rate, CAC, LTV:CAC ratio, and payback period in months. Gartner's B2B buying research is a useful reality check on why lead-to-customer rates have compressed — buying groups have grown, and single-threaded leads convert worse than they did five years ago. Adjust your expected conversion rate to the committee, not the individual.
The failure mode to avoid: optimizing CPL down while CAC goes up. That happens every time you buy cheaper, worse-fitting leads. If your CPL chart is trending down and your win rate is trending down with it, you are not getting more efficient — you are just buying junk faster.
What should you measure next month?#
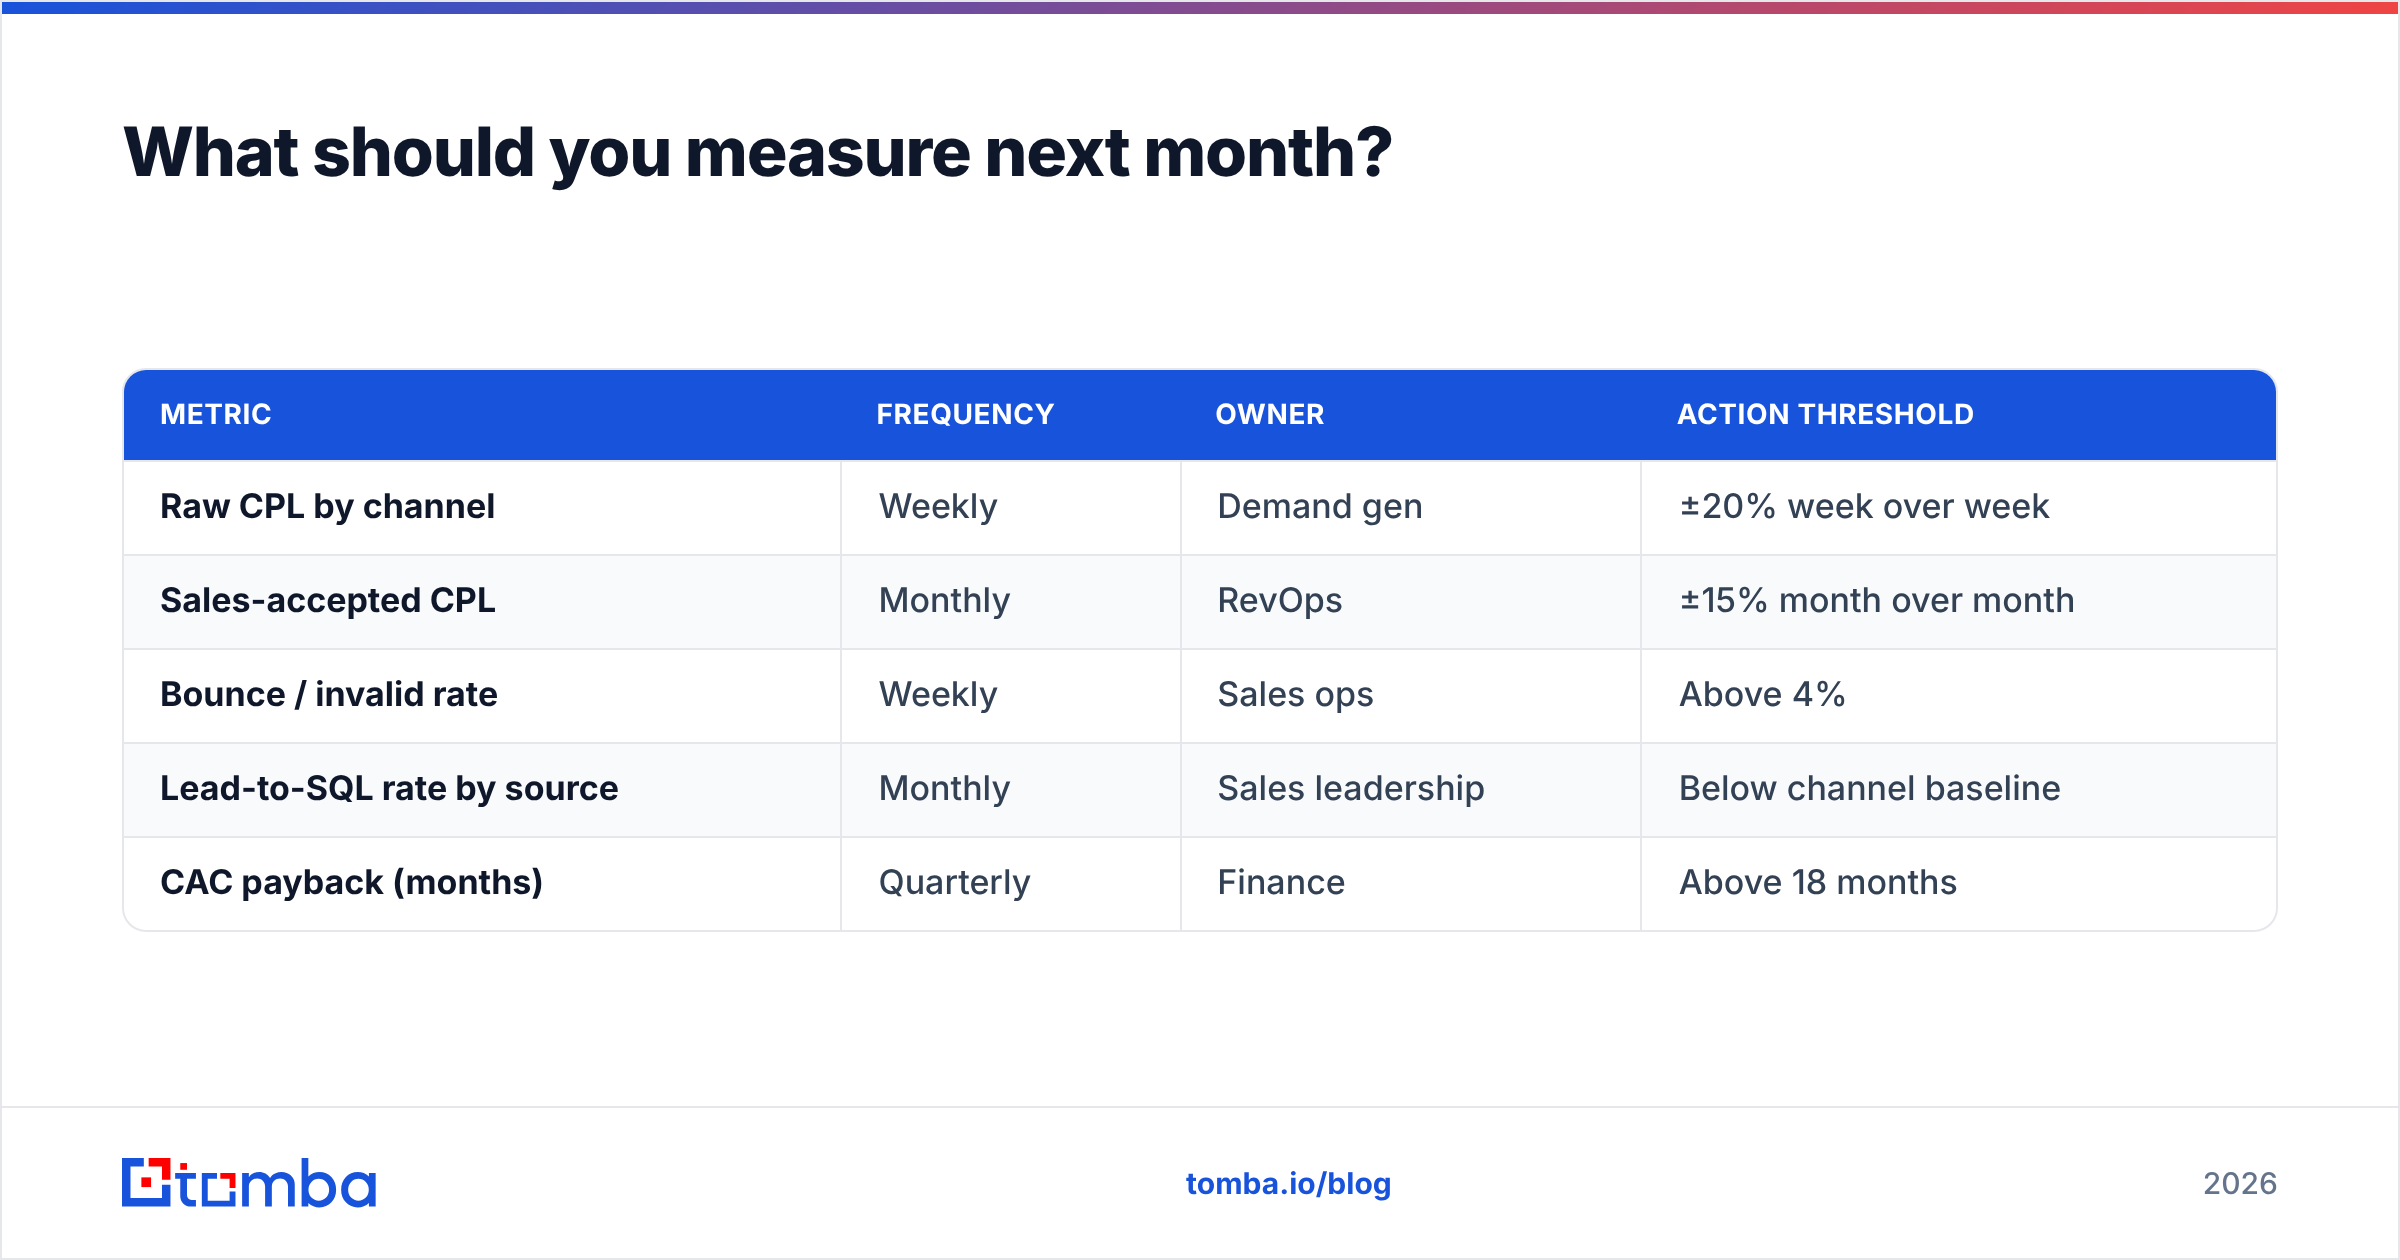
Set up this reporting cadence and CPL stops being a number you argue about:
| Metric | Frequency | Owner | Action threshold |
|---|---|---|---|
| Raw CPL by channel | Weekly | Demand gen | ±20% week over week |
| Sales-accepted CPL | Monthly | RevOps | ±15% month over month |
| Bounce / invalid rate | Weekly | Sales ops | Above 4% |
| Lead-to-SQL rate by source | Monthly | Sales leadership | Below channel baseline |
| CAC payback (months) | Quarterly | Finance | Above 18 months |
Weekly for the volatile numbers, monthly for the ones that need volume to stabilize, quarterly for the ones tied to revenue recognition. Anything measured more often than it can meaningfully move just generates noise and bad decisions.
Finally, write your definitions down. One page: what goes in the numerator, what counts as a lead at each stage, how you handle attribution lag, and how you deduplicate. That page ends more CPL disputes than any dashboard.
Where to start#
If your CPL is high because your contact data is unreliable, that is the cheapest problem you have and the fastest one to fix. Sourcing verified professional addresses upfront removes bounce waste, protects your sending domain, and stops your team from spending hours on contacts who were never reachable.
Try the Tomba Email Finder on your next list — the free tier gives you 25 searches to compare its confidence scores against whatever you are using now, and paid plans start at $49/mo. Run the same 100 target accounts through both, count the bounces, and recalculate your CPL with real numbers. That comparison takes twenty minutes and usually changes the budget conversation.
Related guides#
Ready to find emails that actually work?
Join 150,000+ professionals who stopped guessing and started sending. Free credits on signup — no credit card required.
Get the Tomba newsletter
Practical outbound tactics and product updates — once every two weeks.
About the author