How to Calculate Inbox Placement Rate (2026 Guide)
Delivery rate lies. Inbox placement rate tells you where your cold emails actually land. Here is the exact formula, the seed-list method, and the benchmarks worth chasing in 2026.

TL;DR
- Inbox placement rate (IPR) = (emails landing in the primary or focused inbox ÷ emails actually delivered) × 100. Delivered is the denominator, not sent.
- Your ESP's 99% "delivery rate" only proves the receiving server accepted the message. It says nothing about spam-folder placement, and it never will — mailbox providers don't report folder location back to senders.
- The only reliable measurement method is a seed list: a controlled set of real mailboxes across Gmail, Outlook, Yahoo, and corporate Microsoft 365 tenants that you check after each send.
- Benchmarks worth targeting in 2026: 85%+ IPR is healthy, 70-84% needs work, below 70% means you're burning list and domain reputation simultaneously.
- The cheapest IPR fix isn't authentication tuning — it's list hygiene. Invalid and catch-all addresses drive the bounce and spam-trap signals that push everything else into the junk folder.
What is inbox placement rate, and why is it not delivery rate?#
Inbox placement rate is the percentage of your delivered emails that reach the primary inbox instead of spam, promotions, or a quarantine folder.
Think of it like a package delivery. Your delivery rate says the courier handed the box to someone at the building. Inbox placement rate says whether the box made it to the recipient's desk or got dumped in the basement mailroom nobody checks. The courier's tracking page shows "delivered" in both cases.
That gap is the whole problem. Your sending platform reports what it can see: did the receiving mail server return a 250 OK, or did it bounce? Once the message is accepted, the mailbox provider's filtering happens inside a black box. Gmail does not send you a webhook saying "we filed this under Spam."
So senders end up staring at a 98.7% delivery rate while their reply rate quietly craters. The messages are being delivered — into the junk folder.
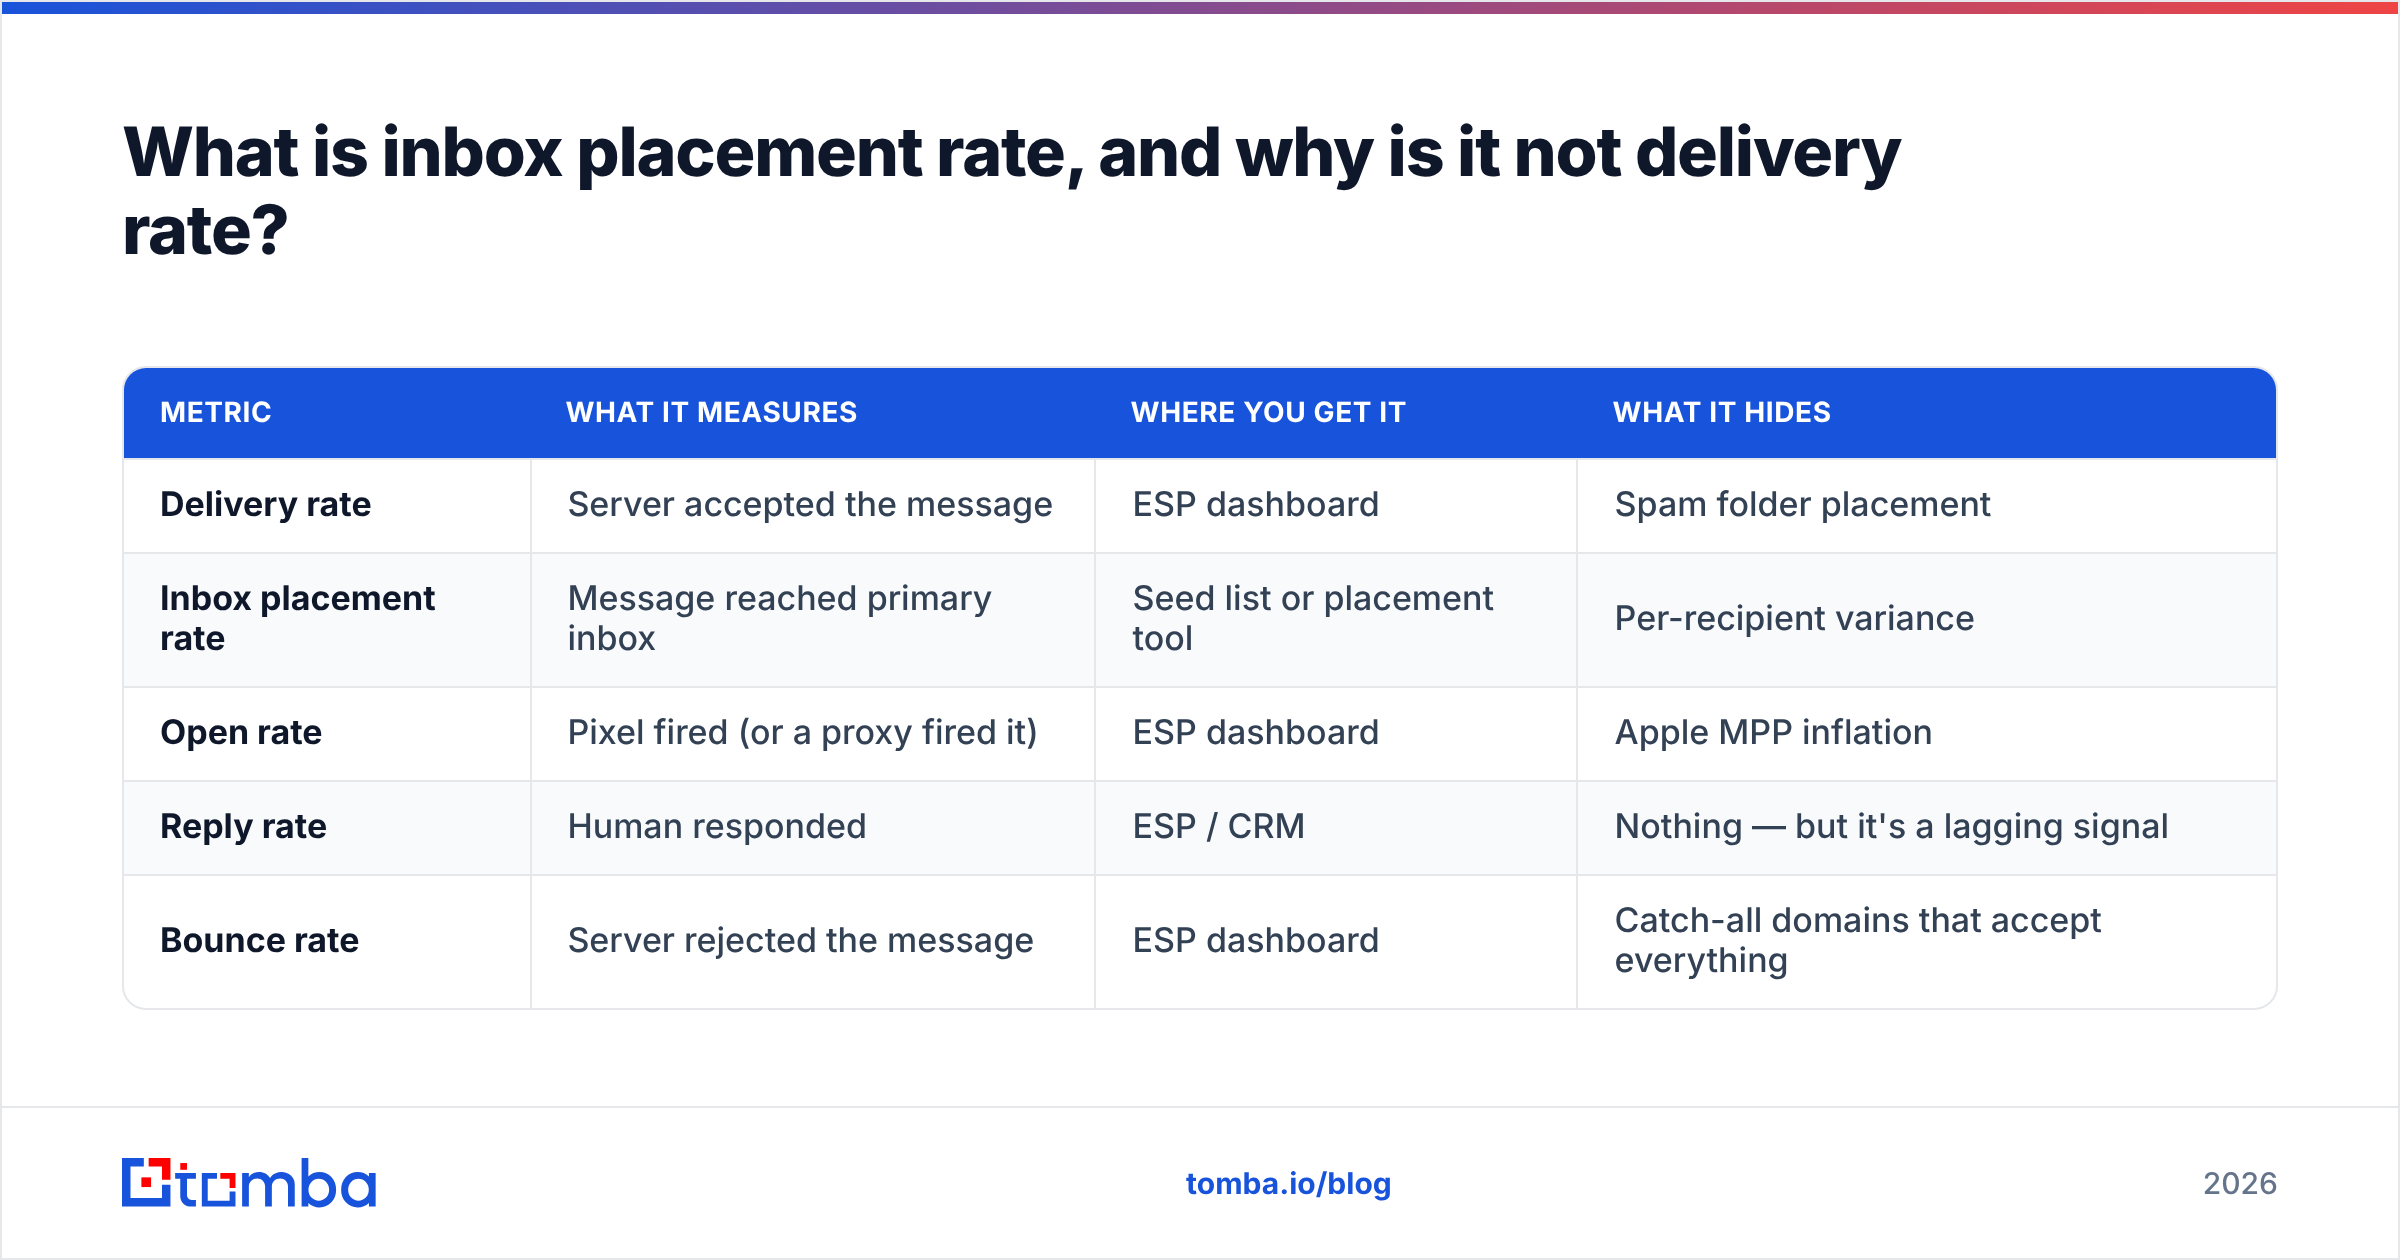
| Metric | What it measures | Where you get it | What it hides |
|---|---|---|---|
| Delivery rate | Server accepted the message | ESP dashboard | Spam folder placement |
| Inbox placement rate | Message reached primary inbox | Seed list or placement tool | Per-recipient variance |
| Open rate | Pixel fired (or a proxy fired it) | ESP dashboard | Apple MPP inflation |
| Reply rate | Human responded | ESP / CRM | Nothing — but it's a lagging signal |
| Bounce rate | Server rejected the message | ESP dashboard | Catch-all domains that accept everything |

What is the formula for inbox placement rate?#
The formula is short. Getting the denominator right is where people go wrong.
Inbox Placement Rate = (Emails in Primary Inbox ÷ Emails Delivered) × 100
Note: delivered, not sent. If you send 1,000 emails and 60 bounce, your delivered figure is 940. Using 1,000 as the denominator understates your placement and mixes two separate problems — list quality and filtering — into one unreadable number.
Worked example:
- Sent: 1,000
- Bounced: 60 → Delivered: 940
- Seed-list check shows: 71% primary inbox, 18% spam, 11% promotions/other
- IPR: 0.71 × 940 = 667 inboxed → 667 ÷ 940 = 71%
- Effective reach: 667 ÷ 1,000 sent = 66.7% of your original list saw the message
That last number — effective reach — is the one to report to a VP. It combines list quality and placement into a single honest figure.
Two variants worth tracking separately:
- Primary IPR counts only the primary/focused tab. This is the strict version and the one that correlates with replies.
- Non-spam IPR counts primary + promotions + updates. Useful for marketing sends, misleading for cold outreach — nobody replies to a cold pitch in the Promotions tab.
For B2B outbound, use Primary IPR. Anything else flatters your numbers.
How do you actually measure inbox placement with a seed list?#
You can't measure IPR from your own analytics. You need seeds — mailboxes you control across the providers your prospects use.
Building a usable seed list:
- Cover the four providers that matter. Google Workspace, Microsoft 365, consumer Gmail, and consumer Outlook/Hotmail. For B2B, weight heavily toward Workspace and M365 — that's where 80%+ of your prospects live.
- Use real, aged mailboxes. A brand-new Gmail account with zero history is not a representative filter. Seeds should be 3+ months old with normal usage patterns.
- Seed on your own custom domains too. Corporate M365 tenants with Defender enabled behave very differently from consumer Outlook. If you sell to enterprise, you need at least one seed behind a real Defender policy.
- Never let seeds engage artificially. If your seed accounts open and reply to every message, you're measuring a warmup network, not filtering behavior. Check placement, then stop.
- Insert seeds mid-campaign, not as a separate blast. Seeds should ride inside the same batch, same sending IP, same copy. A dedicated test send to 20 seeds is a different volume signal and will produce a different result.
- Record placement per provider, not just an average. A 78% blended IPR that's 95% on Google and 41% on Microsoft is a Microsoft problem, and the blended number hides it.
Run this after every meaningful change: new domain, new copy angle, volume increase, new sending infrastructure. Otherwise weekly is enough.
If you'd rather not maintain your own seeds, Google Postmaster Tools gives you spam-rate reporting for Gmail specifically — not full placement data, but the closest free proxy, and the user-reported spam rate it exposes is the single most predictive number you can watch. Microsoft's SNDS offers a rough equivalent for Outlook.
Which tools measure inbox placement rate, and what do they cost?#
Placement testing is a small, crowded market. The differences come down to seed-network size, provider coverage, and whether the tool also fixes the upstream causes.
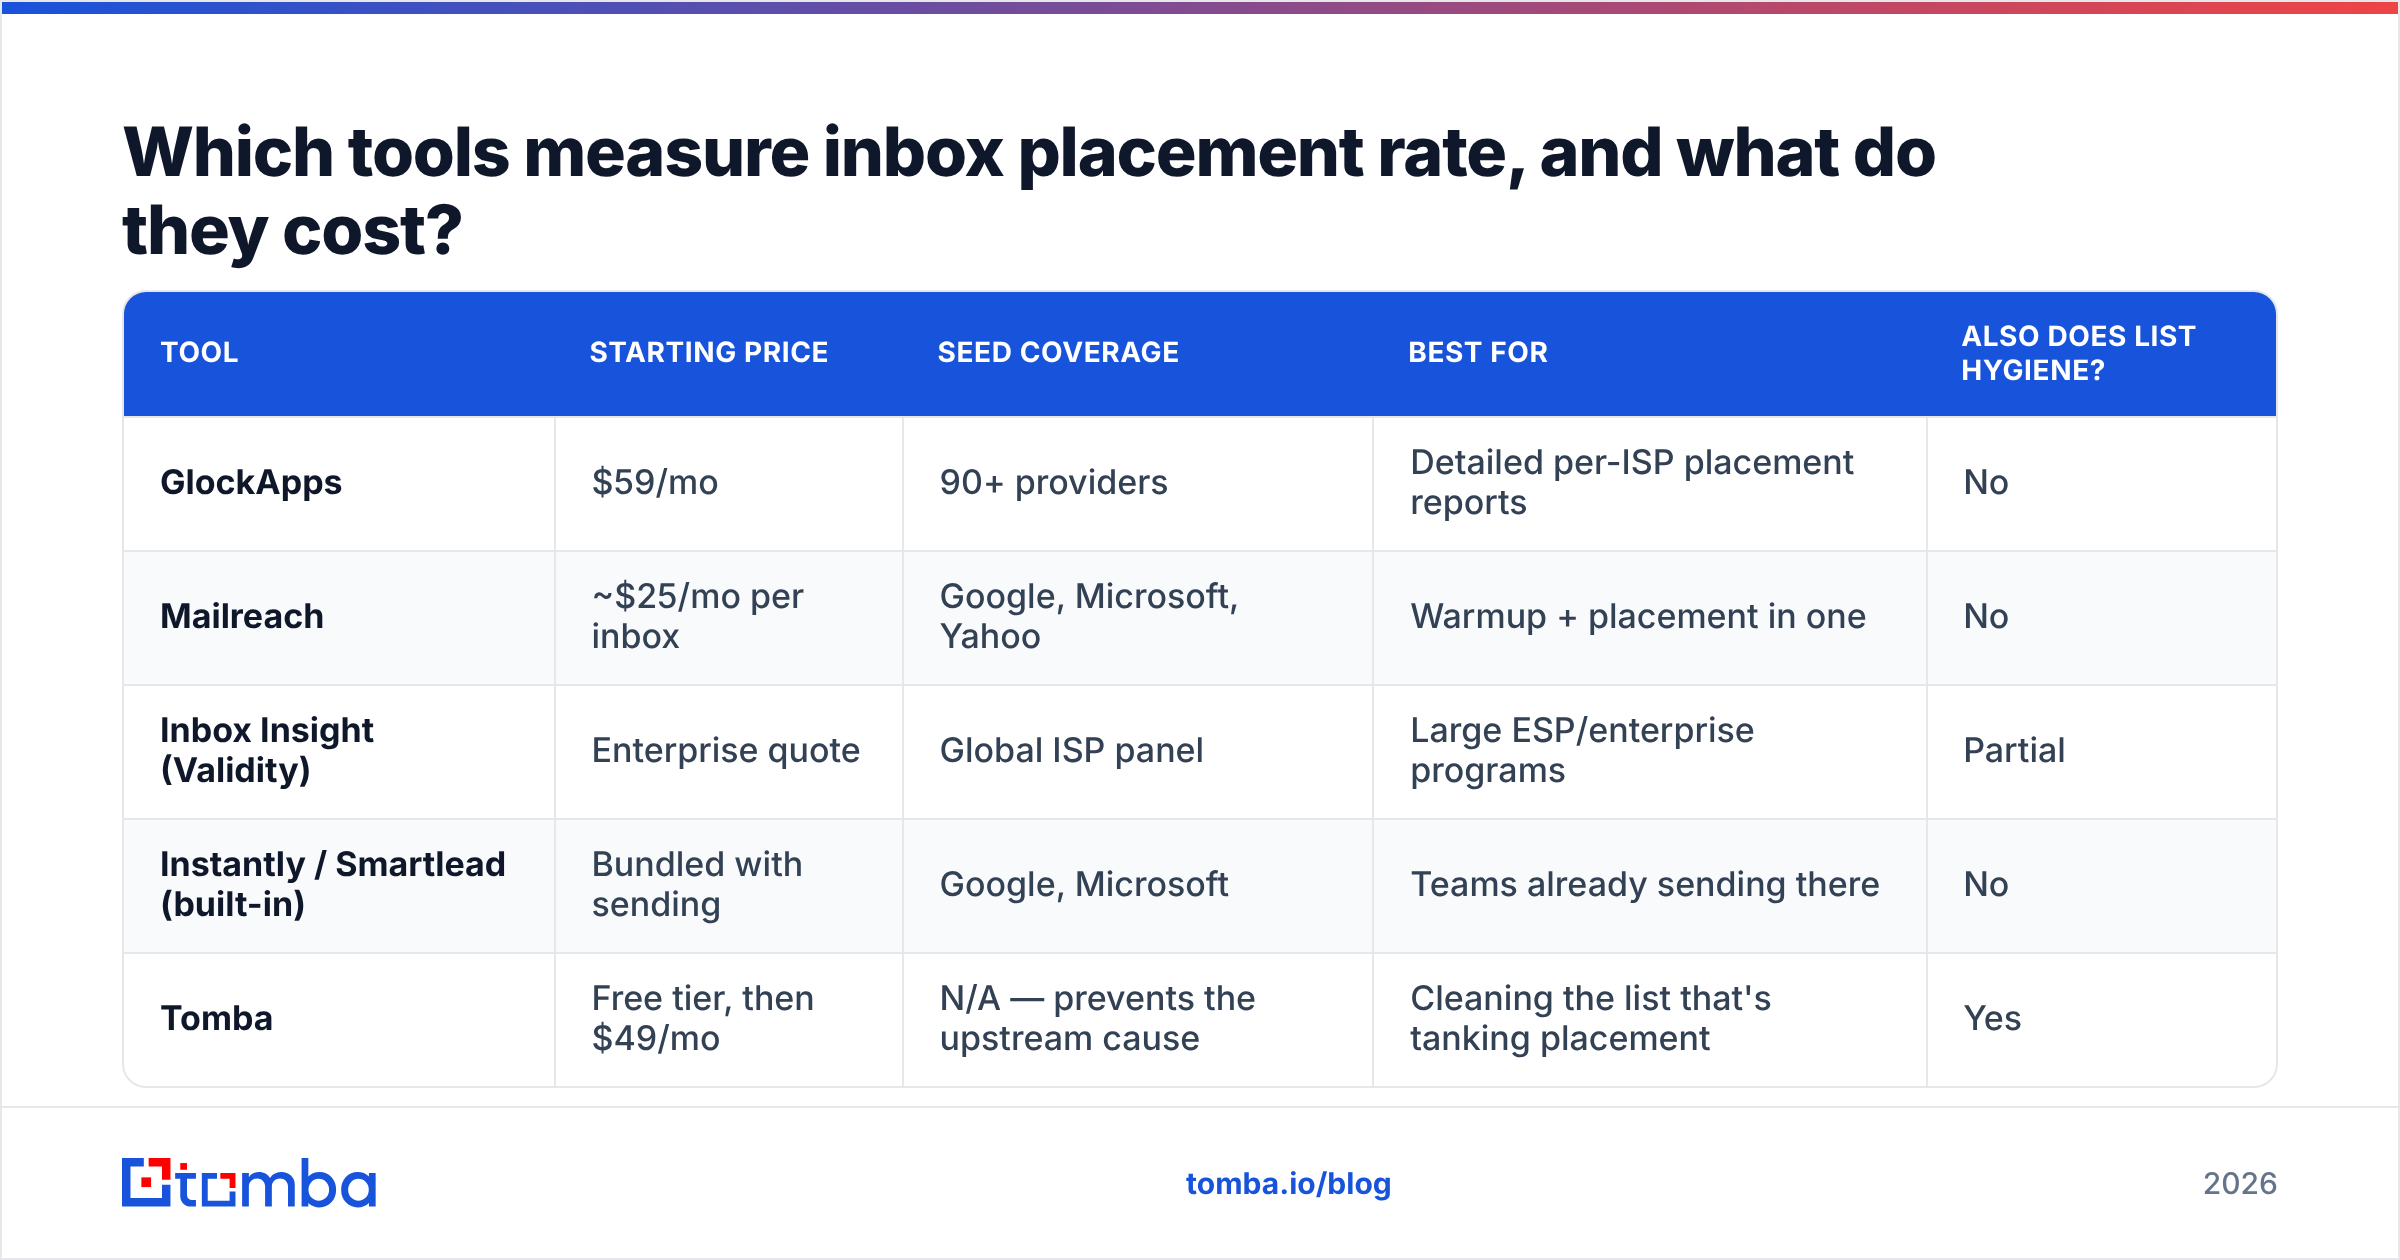
| Tool | Starting price | Seed coverage | Best for | Also does list hygiene? |
|---|---|---|---|---|
| GlockApps | $59/mo | 90+ providers | Detailed per-ISP placement reports | No |
| Mailreach | ~$25/mo per inbox | Google, Microsoft, Yahoo | Warmup + placement in one | No |
| Inbox Insight (Validity) | Enterprise quote | Global ISP panel | Large ESP/enterprise programs | Partial |
| Instantly / Smartlead (built-in) | Bundled with sending | Google, Microsoft | Teams already sending there | No |
| Tomba | Free tier, then $49/mo | N/A — prevents the upstream cause | Cleaning the list that's tanking placement | Yes |
Tomba is not a placement-testing tool and shouldn't be positioned as one. It sits one step earlier in the chain: the email verifier and catch-all verifier remove the invalid addresses and risky catch-all domains that generate the bounce and complaint signals that wreck placement in the first place. Measuring IPR without fixing list quality is like weighing yourself daily and changing nothing.
What is a good inbox placement rate in 2026?#
Benchmarks vary by sending model, but here's a workable scale for B2B outbound:
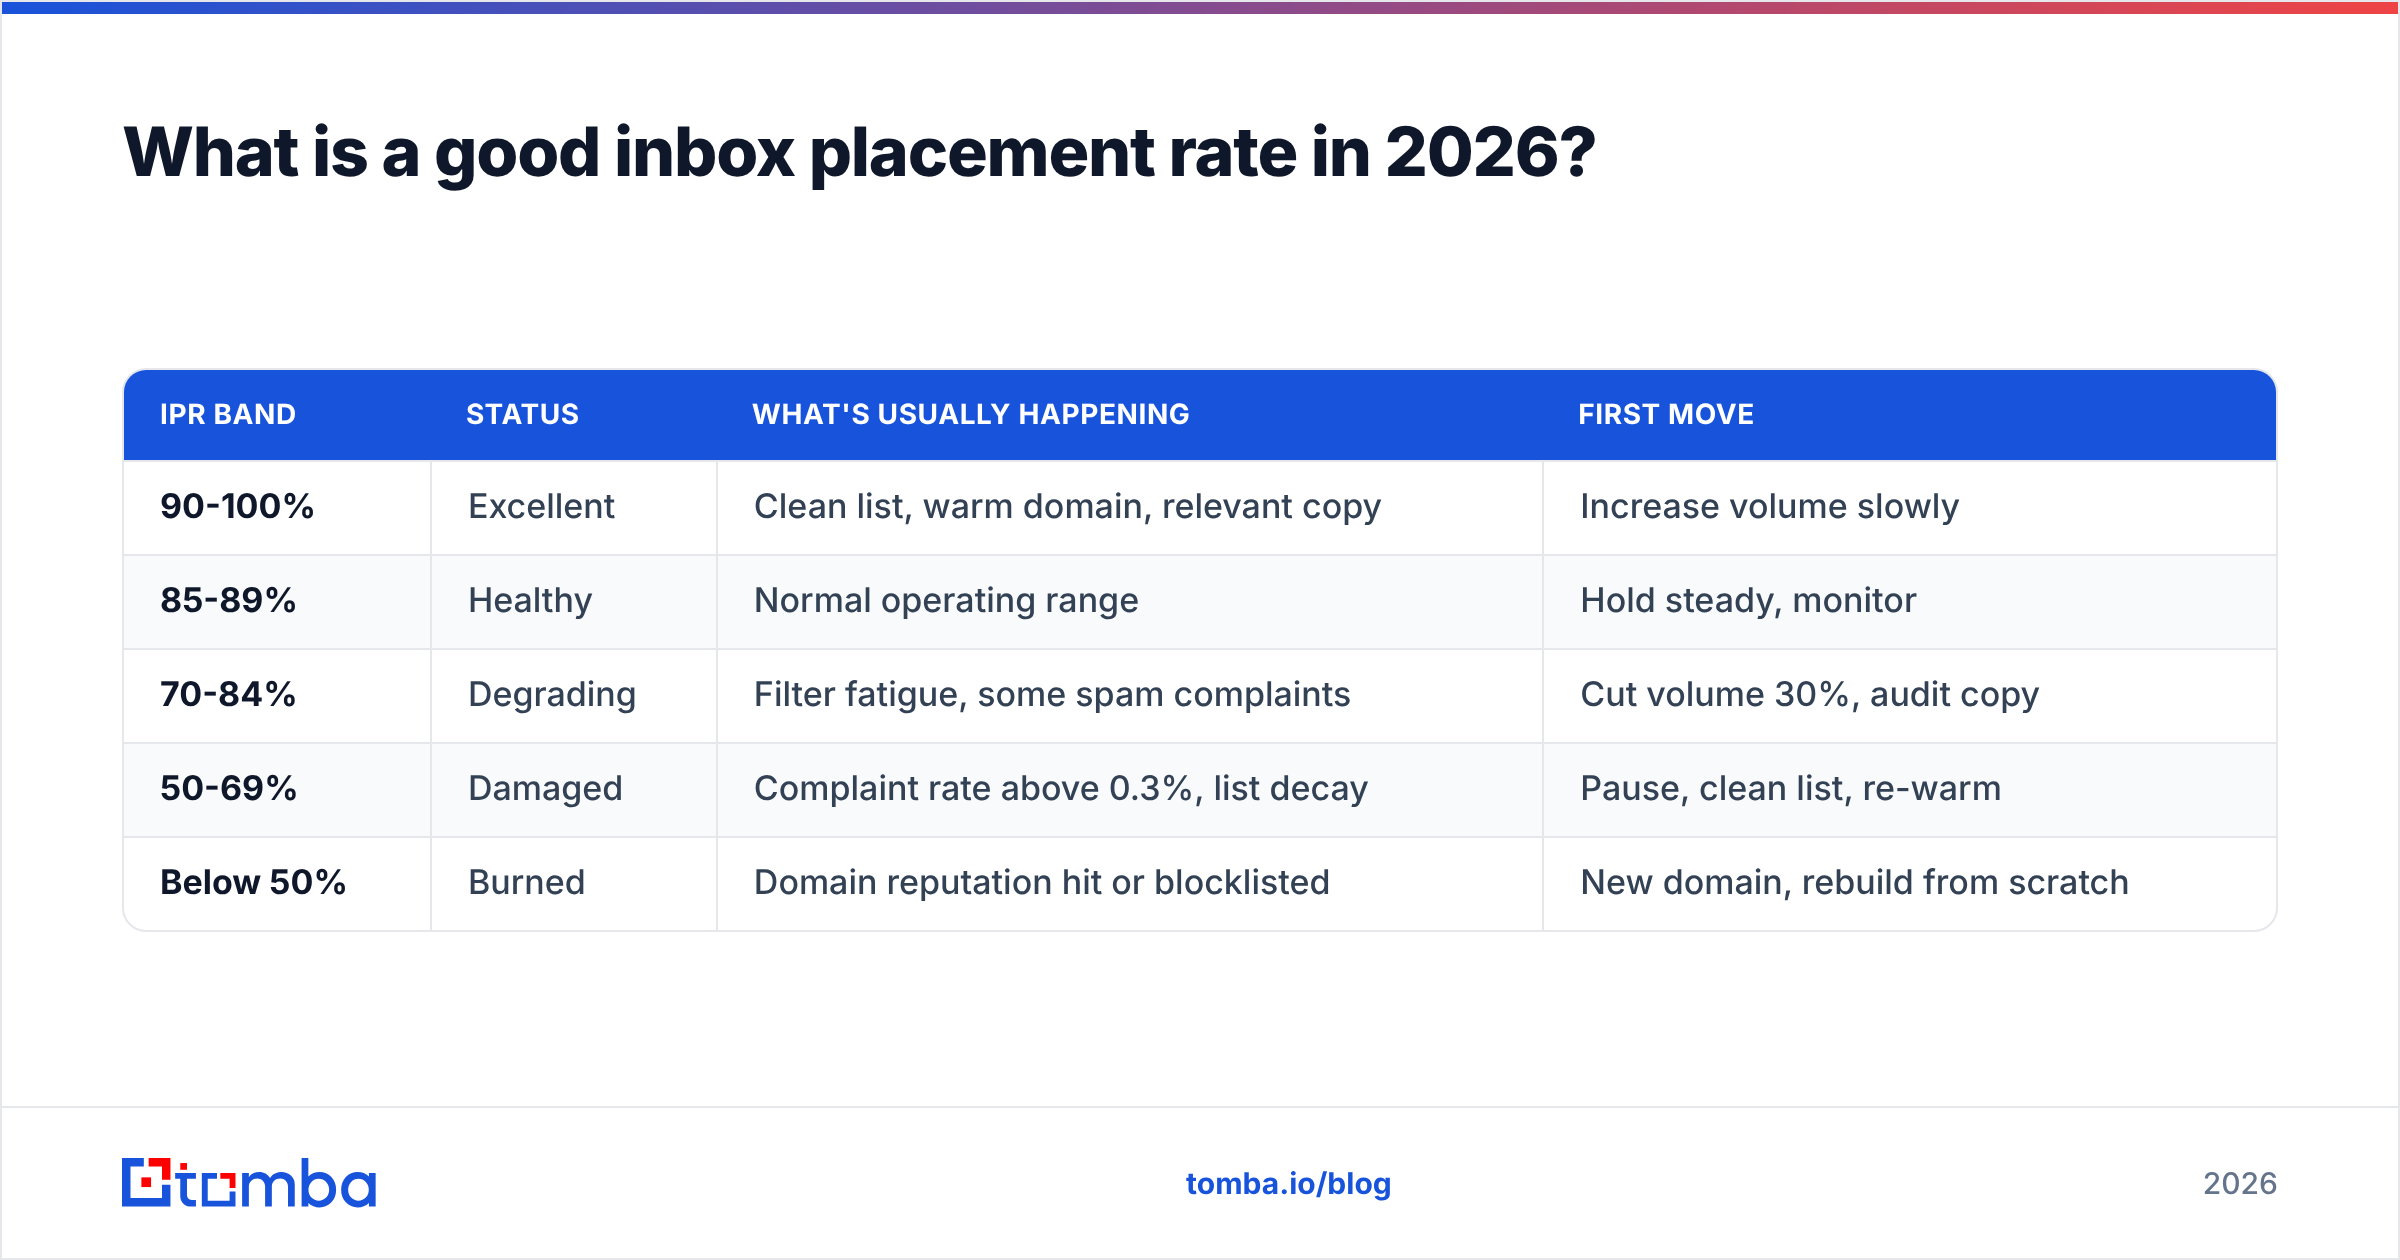
| IPR band | Status | What's usually happening | First move |
|---|---|---|---|
| 90-100% | Excellent | Clean list, warm domain, relevant copy | Increase volume slowly |
| 85-89% | Healthy | Normal operating range | Hold steady, monitor |
| 70-84% | Degrading | Filter fatigue, some spam complaints | Cut volume 30%, audit copy |
| 50-69% | Damaged | Complaint rate above 0.3%, list decay | Pause, clean list, re-warm |
| Below 50% | Burned | Domain reputation hit or blocklisted | New domain, rebuild from scratch |
Two caveats. First, IPR is provider-specific — 88% on Gmail and 52% on Microsoft is a common and very fixable pattern, usually caused by aggressive link usage or a spammy-looking sending domain that Defender flags. Second, IPR is not stable. A domain sitting at 91% can drop to 60% within four days of a single bad campaign, which is why one-time measurement is nearly useless. Track the trend line.
Industry deliverability research consistently puts average global inbox placement in the low-to-mid 80s, with B2B cold outreach running meaningfully below that. If you're at 85% on cold email, you're outperforming the field.
Why does inbox placement drop, and how do you fix it?#
Placement problems trace back to four sources, roughly in order of how often they're the actual culprit.
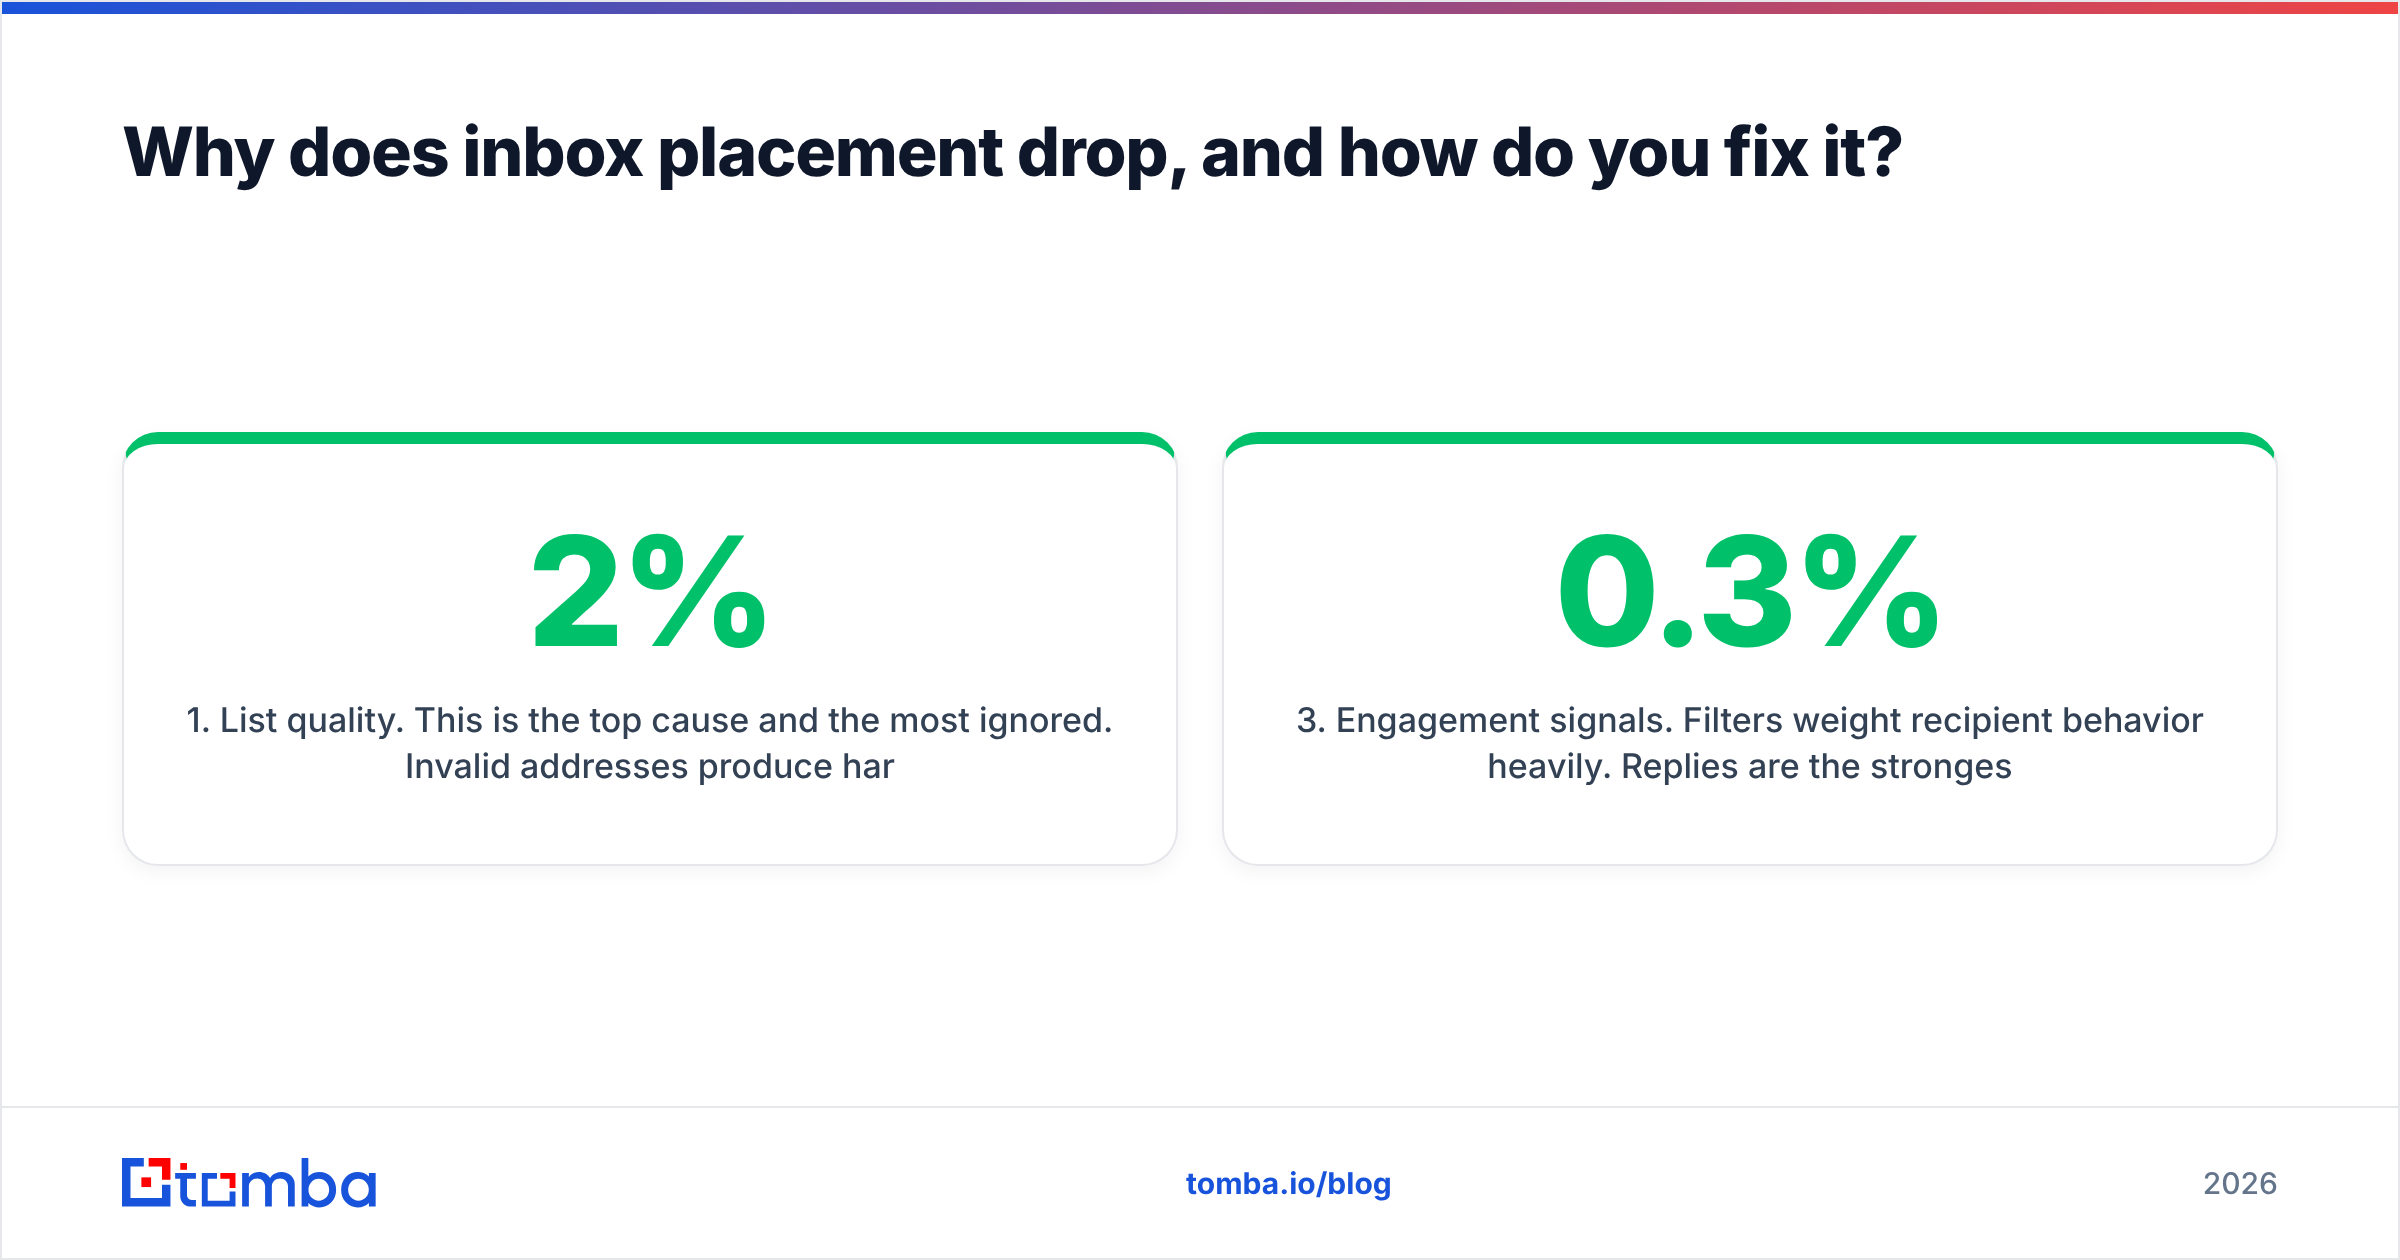
1. List quality. This is the top cause and the most ignored. Invalid addresses produce hard bounces; hard bounce rates above 2% are a direct reputation hit. Worse, scraped or purchased lists carry recycled spam traps — addresses that were real, went dormant, and got reactivated by providers specifically to catch senders who don't clean their data. One trap hit can cost you 20 points of placement. Verify every address before it enters a sequence, and re-verify anything older than 90 days.
2. Authentication gaps. SPF, DKIM, and DMARC are table stakes now that Google and Yahoo enforce them for bulk senders. Missing DMARC won't tank a small sender immediately, but it caps your ceiling. Run an SPF checker and confirm your DMARC policy is at least p=none with reporting enabled — you can't diagnose what you don't collect.
3. Engagement signals. Filters weight recipient behavior heavily. Replies are the strongest positive signal; deletions without opening and manual spam reports are the strongest negatives. A complaint rate above 0.3% is the threshold Google publicly flags. This is a copy and targeting problem masquerading as a technical one — if your response rate is under 1%, no amount of DNS tuning will save your placement.
4. Volume and pattern. Sudden ramps, identical copy across thousands of recipients, and heavy link/image density all trigger filters. Warm new domains over 3-4 weeks, cap per-inbox daily volume around 30-50 for cold outreach, and vary your copy.

The fix sequence, in order:
- Clean the list. Remove invalids, deduplicate, and quarantine catch-alls into a separate low-volume segment.
- Fix authentication. SPF, DKIM, DMARC on every sending domain, verified with a real lookup, not a memory of setting it up once.
- Cut volume. Half your sending for two weeks while reputation recovers.
- Rewrite the copy. Shorter, one link maximum, no images, no tracking pixel on the first touch.
- Re-measure with seeds. Compare against your pre-fix baseline per provider.
Most teams skip step one and start at step two. That's backwards — Validity's deliverability research has repeatedly pointed to list quality and complaint rates as the dominant placement factors, well ahead of authentication once the basics are in place.
How do you build IPR into a repeatable workflow?#
Measurement only helps if it changes behavior. Here's a cadence that works for a team running cold outbound at moderate volume:
- Before every campaign: Run the list through verification. Anything that comes back as invalid or risky doesn't get sent. Use bulk verify if you're processing thousands of rows.
- Day 1 of a campaign: Seed test on a sample batch. If Primary IPR is under 80%, pause and diagnose before the full send.
- Weekly: Check Google Postmaster spam rate and your seed placement trend. Two consecutive weekly declines is a signal, one is noise.
- Monthly: Re-verify any contact records older than 90 days. B2B data decays at roughly 2-2.5% per month from job changes alone.
- Quarterly: Rotate or retire sending domains that have plateaued below 80%, and audit your email deliverability setup end to end.
Put IPR on the same dashboard as reply rate and meetings booked. When placement drops, replies drop with a two-to-three-day lag — and if you're only watching replies, you'll blame the copy for what was actually a filtering problem.
Where should you start?#
Start with the denominator you can actually control: the list.
Placement testing tells you where you stand. It doesn't tell you what to do, and it can't repair the address quality that caused the drop. Before you buy a seed-testing subscription, run your existing list through verification and see how many addresses are invalid, disposable, or sitting on catch-all domains you can't confirm. On most cold lists we've seen, that number is between 12% and 30% — and removing it moves placement more than any DNS change will.
Tomba's Email Finder sources verified professional addresses at the point of discovery, so the contacts entering your sequences are already validated rather than cleaned up after they've bounced. The free tier gives you 25 searches a month to test the data quality against a segment you already know; paid plans start at $49/mo on Starter, with Growth at $99/mo and Pro at $249/mo — full Tomba pricing is on the site. Find clean addresses first, then measure placement. That order matters.
Related guides#
Ready to find emails that actually work?
Join 150,000+ professionals who stopped guessing and started sending. Free credits on signup — no credit card required.
Get the Tomba newsletter
Practical outbound tactics and product updates — once every two weeks.
About the author