Email Deliverability Statistics 2026: 41 Benchmarks That Matter
Roughly one in six commercial emails never reaches the inbox. Here are the deliverability benchmarks that actually predict placement in 2026 — bounce rates, spam complaints, authentication pass rates — and the thresholds that get you filtered.
TL;DR
- Around 83–85% of legitimate commercial email reaches the inbox. The remaining 15–17% is split between spam folders and hard blocks you never see reported.
- The single strongest predictor of a deliverability collapse is bounce rate. Mailbox providers start throttling long before you hit the "official" thresholds — treat 2% as your ceiling, not 5%.
- Spam complaint rate is the metric Google and Yahoo actually enforce: stay under 0.10%, and never touch 0.30%.
- Authentication is now table stakes. SPF, DKIM, and DMARC alignment are required for bulk senders at Gmail and Yahoo — a missing DMARC record is a hard fail, not a warning.
- Most "deliverability problems" are list problems. Verified lists bounce at roughly 0.5–2%; scraped or purchased lists commonly bounce at 15–30%.
What counts as an email deliverability statistic — and what doesn't?#
Start with the definition, because most published numbers conflate two different things.
Delivery rate is the percentage of emails that weren't bounced by the receiving server. Deliverability, or inbox placement rate, is the percentage that landed in the primary inbox rather than spam, promotions purgatory, or a silent block. A campaign can post a 99% delivery rate and a 62% inbox placement rate at the same time. Your ESP dashboard shows you the first number. The second one is invisible unless you seed-test for it.
That gap is where most sending programs quietly die. You see "delivered: 4,950 of 5,000," you assume things are fine, and you never learn that 1,800 of those messages went straight to spam.
The other trap is source quality. A large share of the email deliverability statistics floating around blogs trace back to a single vendor report from three or four years ago, re-cited until the original context disappears. When you see a number here, treat it as a directional benchmark drawn from aggregated industry reporting — not a law of physics. Your own seed tests and Postmaster data always outrank a blog average, including this one.
What are the baseline email deliverability statistics for 2026?#
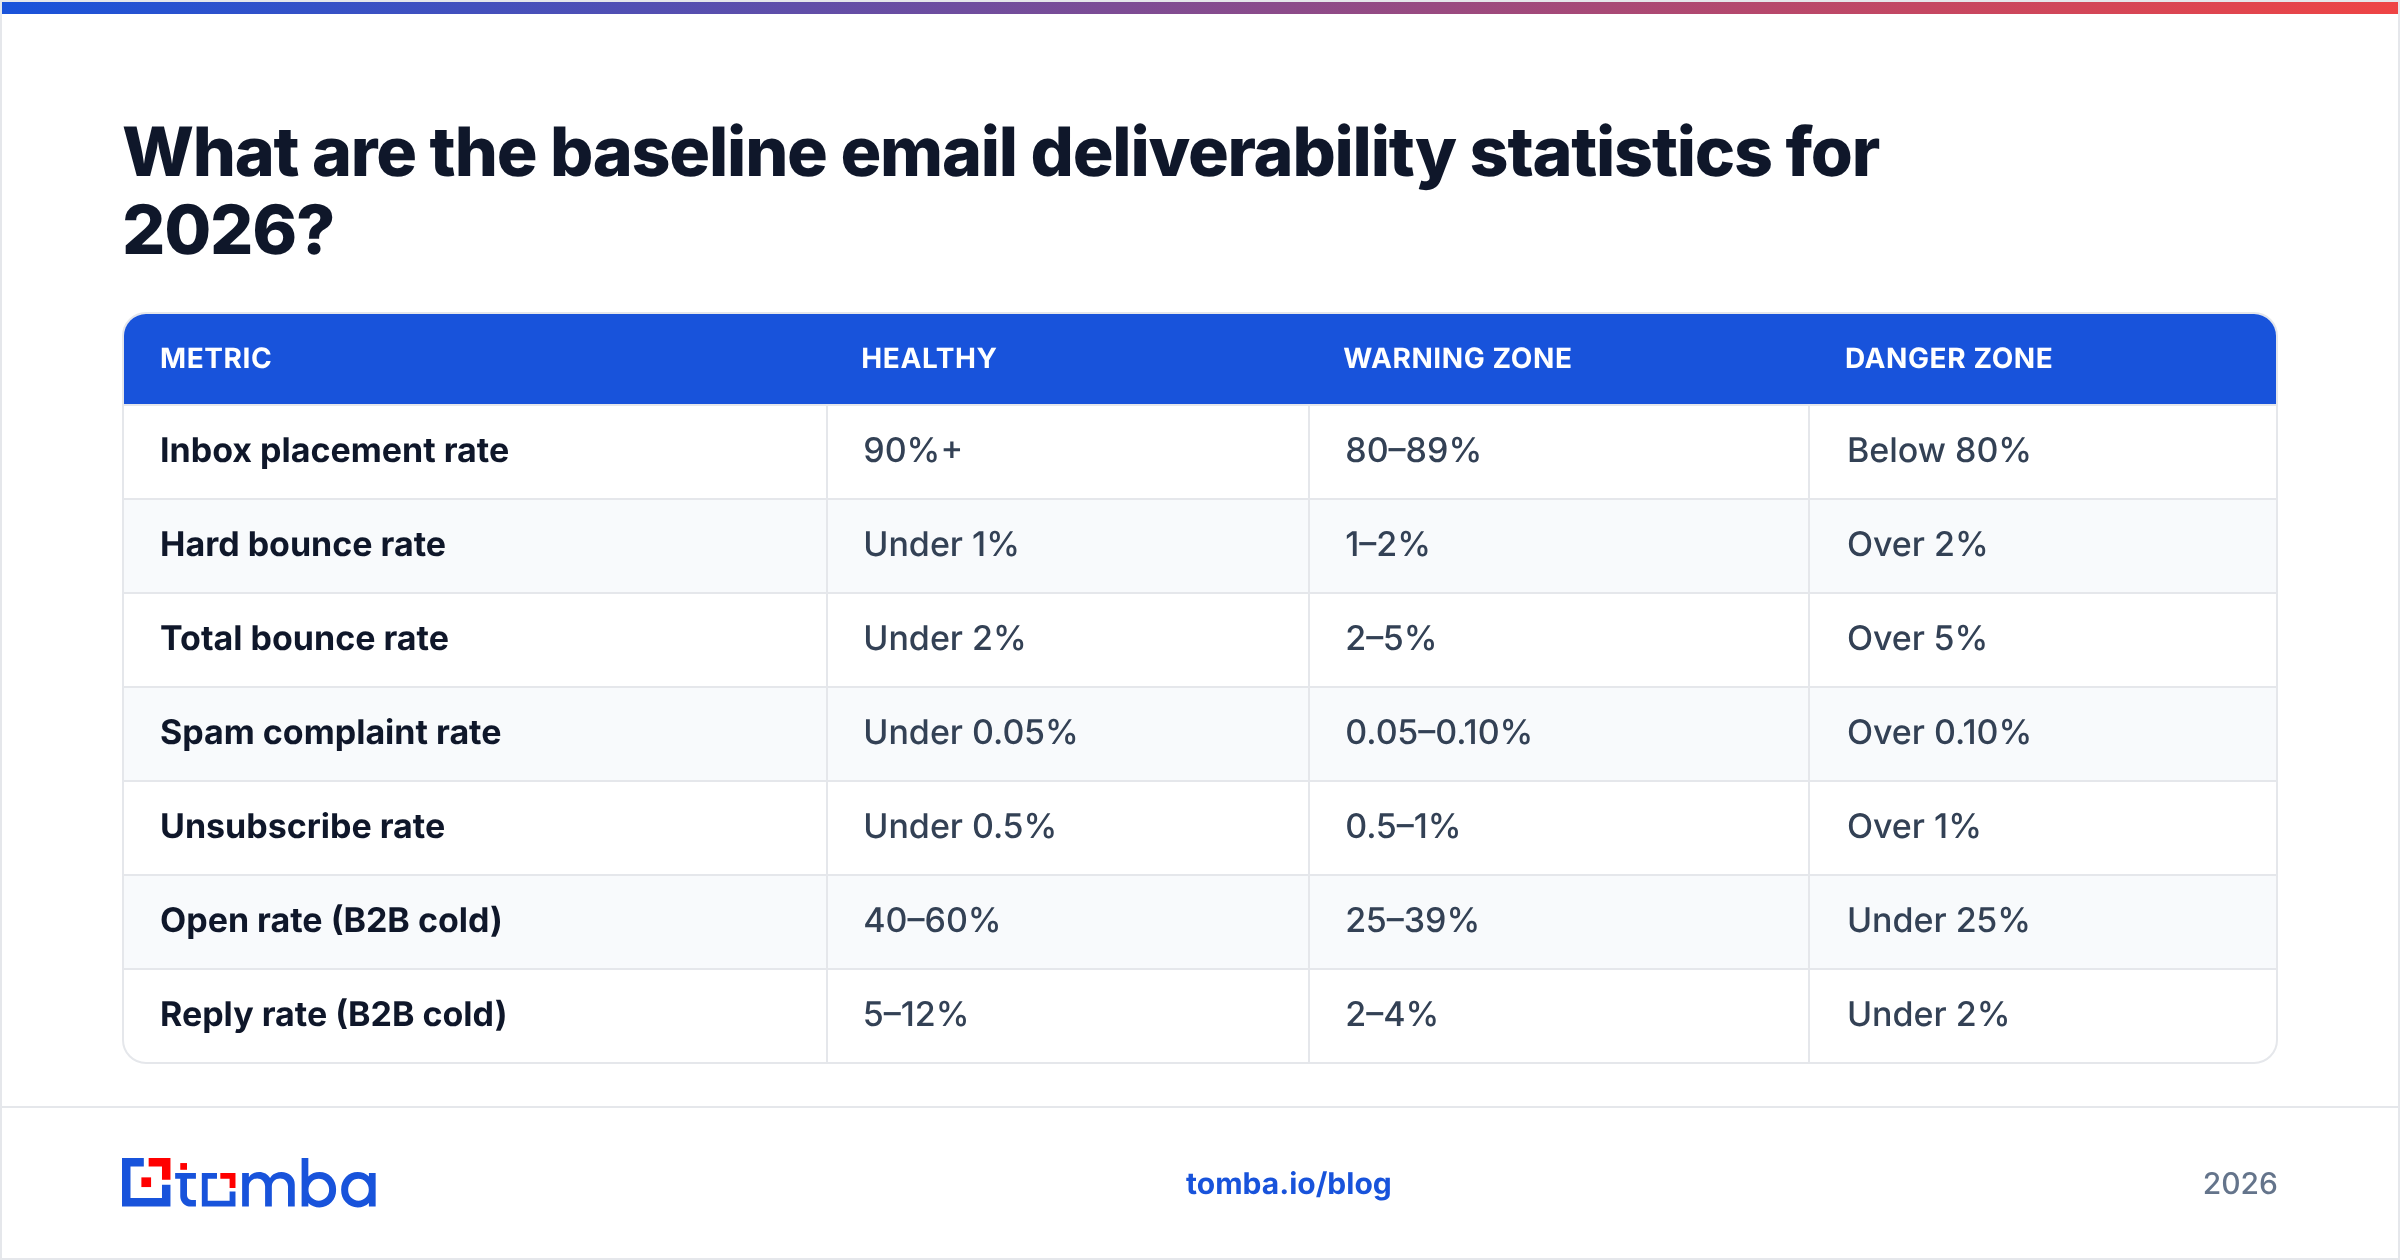
Here's the working set of benchmarks worth calibrating against. These reflect commonly reported ranges across major ESP and deliverability-vendor datasets, plus what mailbox providers publish directly.
| Metric | Healthy | Warning zone | Danger zone |
|---|---|---|---|
| Inbox placement rate | 90%+ | 80–89% | Below 80% |
| Hard bounce rate | Under 1% | 1–2% | Over 2% |
| Total bounce rate | Under 2% | 2–5% | Over 5% |
| Spam complaint rate | Under 0.05% | 0.05–0.10% | Over 0.10% |
| Unsubscribe rate | Under 0.5% | 0.5–1% | Over 1% |
| Open rate (B2B cold) | 40–60% | 25–39% | Under 25% |
| Reply rate (B2B cold) | 5–12% | 2–4% | Under 2% |
| Authentication pass (SPF/DKIM/DMARC) | 100% | 95–99% | Under 95% |
| Domain age before sending | 60+ days | 30–59 days | Under 30 days |
| Daily volume per inbox (cold) | 20–40 | 40–75 | Over 75 |
Two things to notice.
First, the danger thresholds are much tighter than intuition suggests. A 5% bounce rate feels survivable; to a filter, it reads as "this sender does not know who they are emailing." Second, the metrics interact. A 3% bounce rate on a warmed, authenticated domain with a 0.01% complaint rate is recoverable. The same bounce rate on a two-week-old domain sending 200 messages a day is a shutdown.
Why does roughly one in six emails never reach the inbox?#
Because filtering is now overwhelmingly reputation-driven rather than content-driven, and reputation is calculated per-domain, per-IP, and increasingly per-sending-pattern.
The commonly cited global figure is that about 83–85% of permission-based commercial email reaches the inbox, with the shortfall split roughly two-to-one between spam placement and outright non-delivery. Regional variance is significant — European inbox rates typically report a few points higher than North American ones, and Asia-Pacific averages trail both, largely due to differences in provider mix.
The mechanical causes break down predictably:
- Invalid recipients. Dead addresses generate hard bounces, and hard bounces are the loudest negative signal you can send. A list that's 18 months old typically decays 20–30% per year through job changes alone.
- Missing or misaligned authentication. An SPF record that passes but doesn't align with your From domain still fails DMARC. Check yours with a free SPF checker before you blame the copy.
- Volume spikes. Going from 50 to 500 sends a day on the same domain looks exactly like a compromised account.
- Engagement collapse. Providers weight opens, replies, and moves-to-inbox heavily. Sustained low engagement pushes the whole domain toward the spam folder.
- Complaint accumulation. One complaint per thousand is the practical limit. Two per thousand is a problem you have days, not weeks, to fix.
- Catch-all ambiguity. Domains that accept everything hide their invalid addresses until the bounce arrives later — or until the provider quietly drops the message.

How much do bounce rates actually differ by list source?#
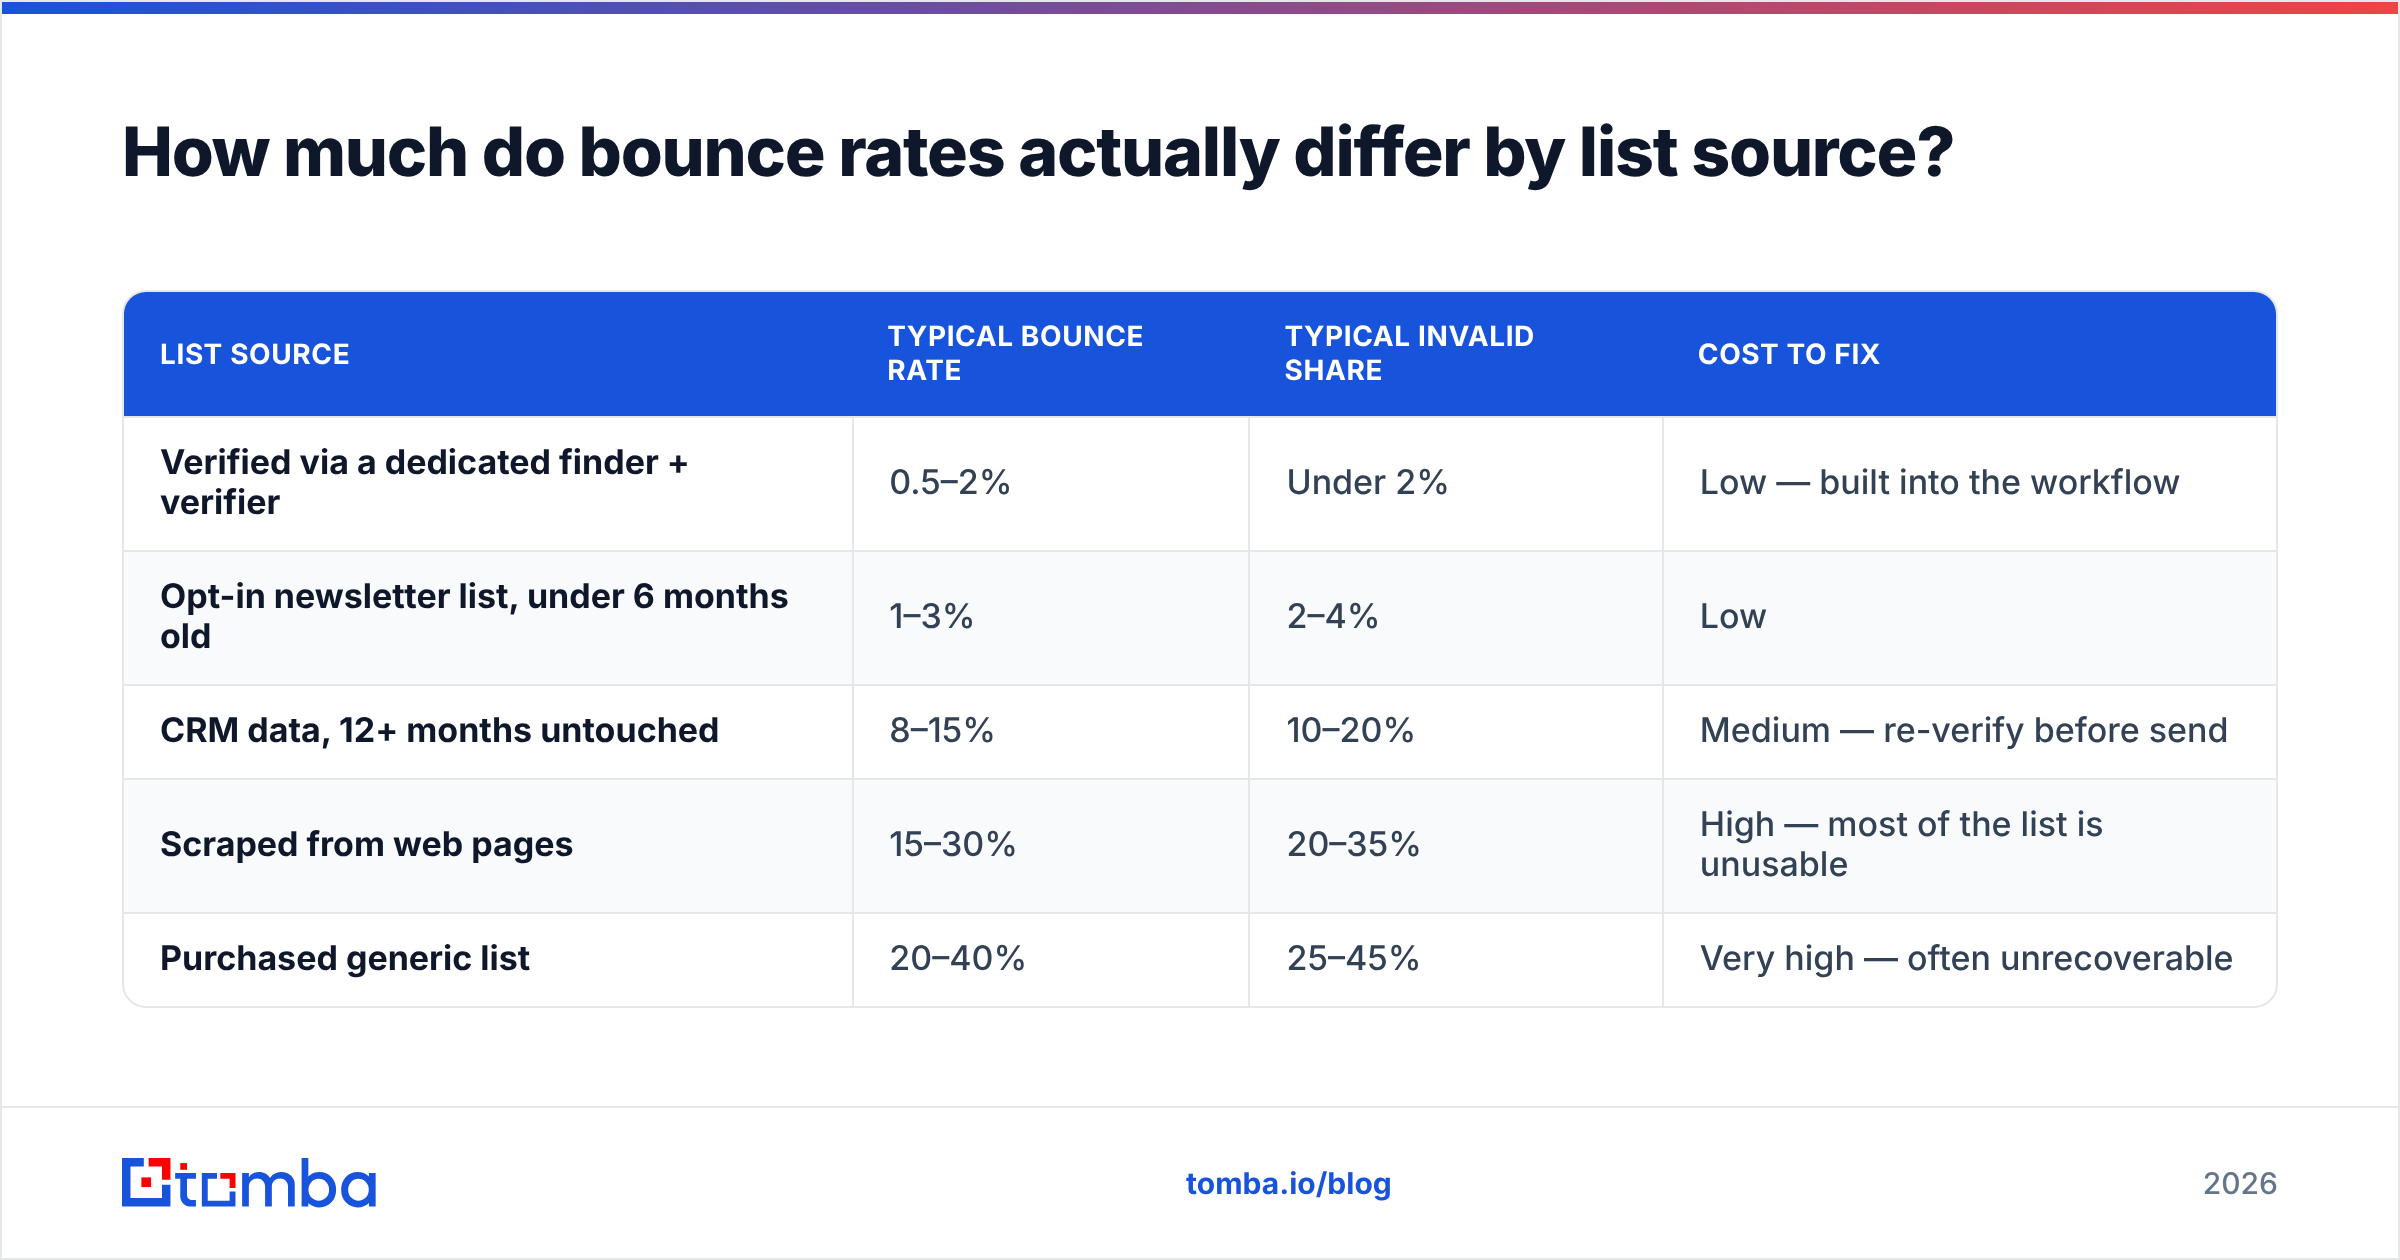
This is the statistic that changes behaviour fastest, because the spread is enormous and entirely within your control.
| List source | Typical bounce rate | Typical invalid share | Cost to fix |
|---|---|---|---|
| Verified via a dedicated finder + verifier | 0.5–2% | Under 2% | Low — built into the workflow |
| Opt-in newsletter list, under 6 months old | 1–3% | 2–4% | Low |
| CRM data, 12+ months untouched | 8–15% | 10–20% | Medium — re-verify before send |
| Scraped from web pages | 15–30% | 20–35% | High — most of the list is unusable |
| Purchased generic list | 20–40% | 25–45% | Very high — often unrecoverable |
A 25% bounce rate isn't just 25% wasted volume. It's a domain reputation event. Mailbox providers respond to bounce spikes within a single campaign, which means a bad list can degrade placement for the good addresses in the same send.
The arithmetic is simple: verifying 10,000 addresses costs far less than rehabilitating a burnt sending domain, which typically takes 4–8 weeks of reduced volume and careful re-warming. Run every list through an email verifier before it touches a sequencer, and route ambiguous domains through a catch-all verifier rather than guessing.
What do the 2026 sender requirements actually enforce?#
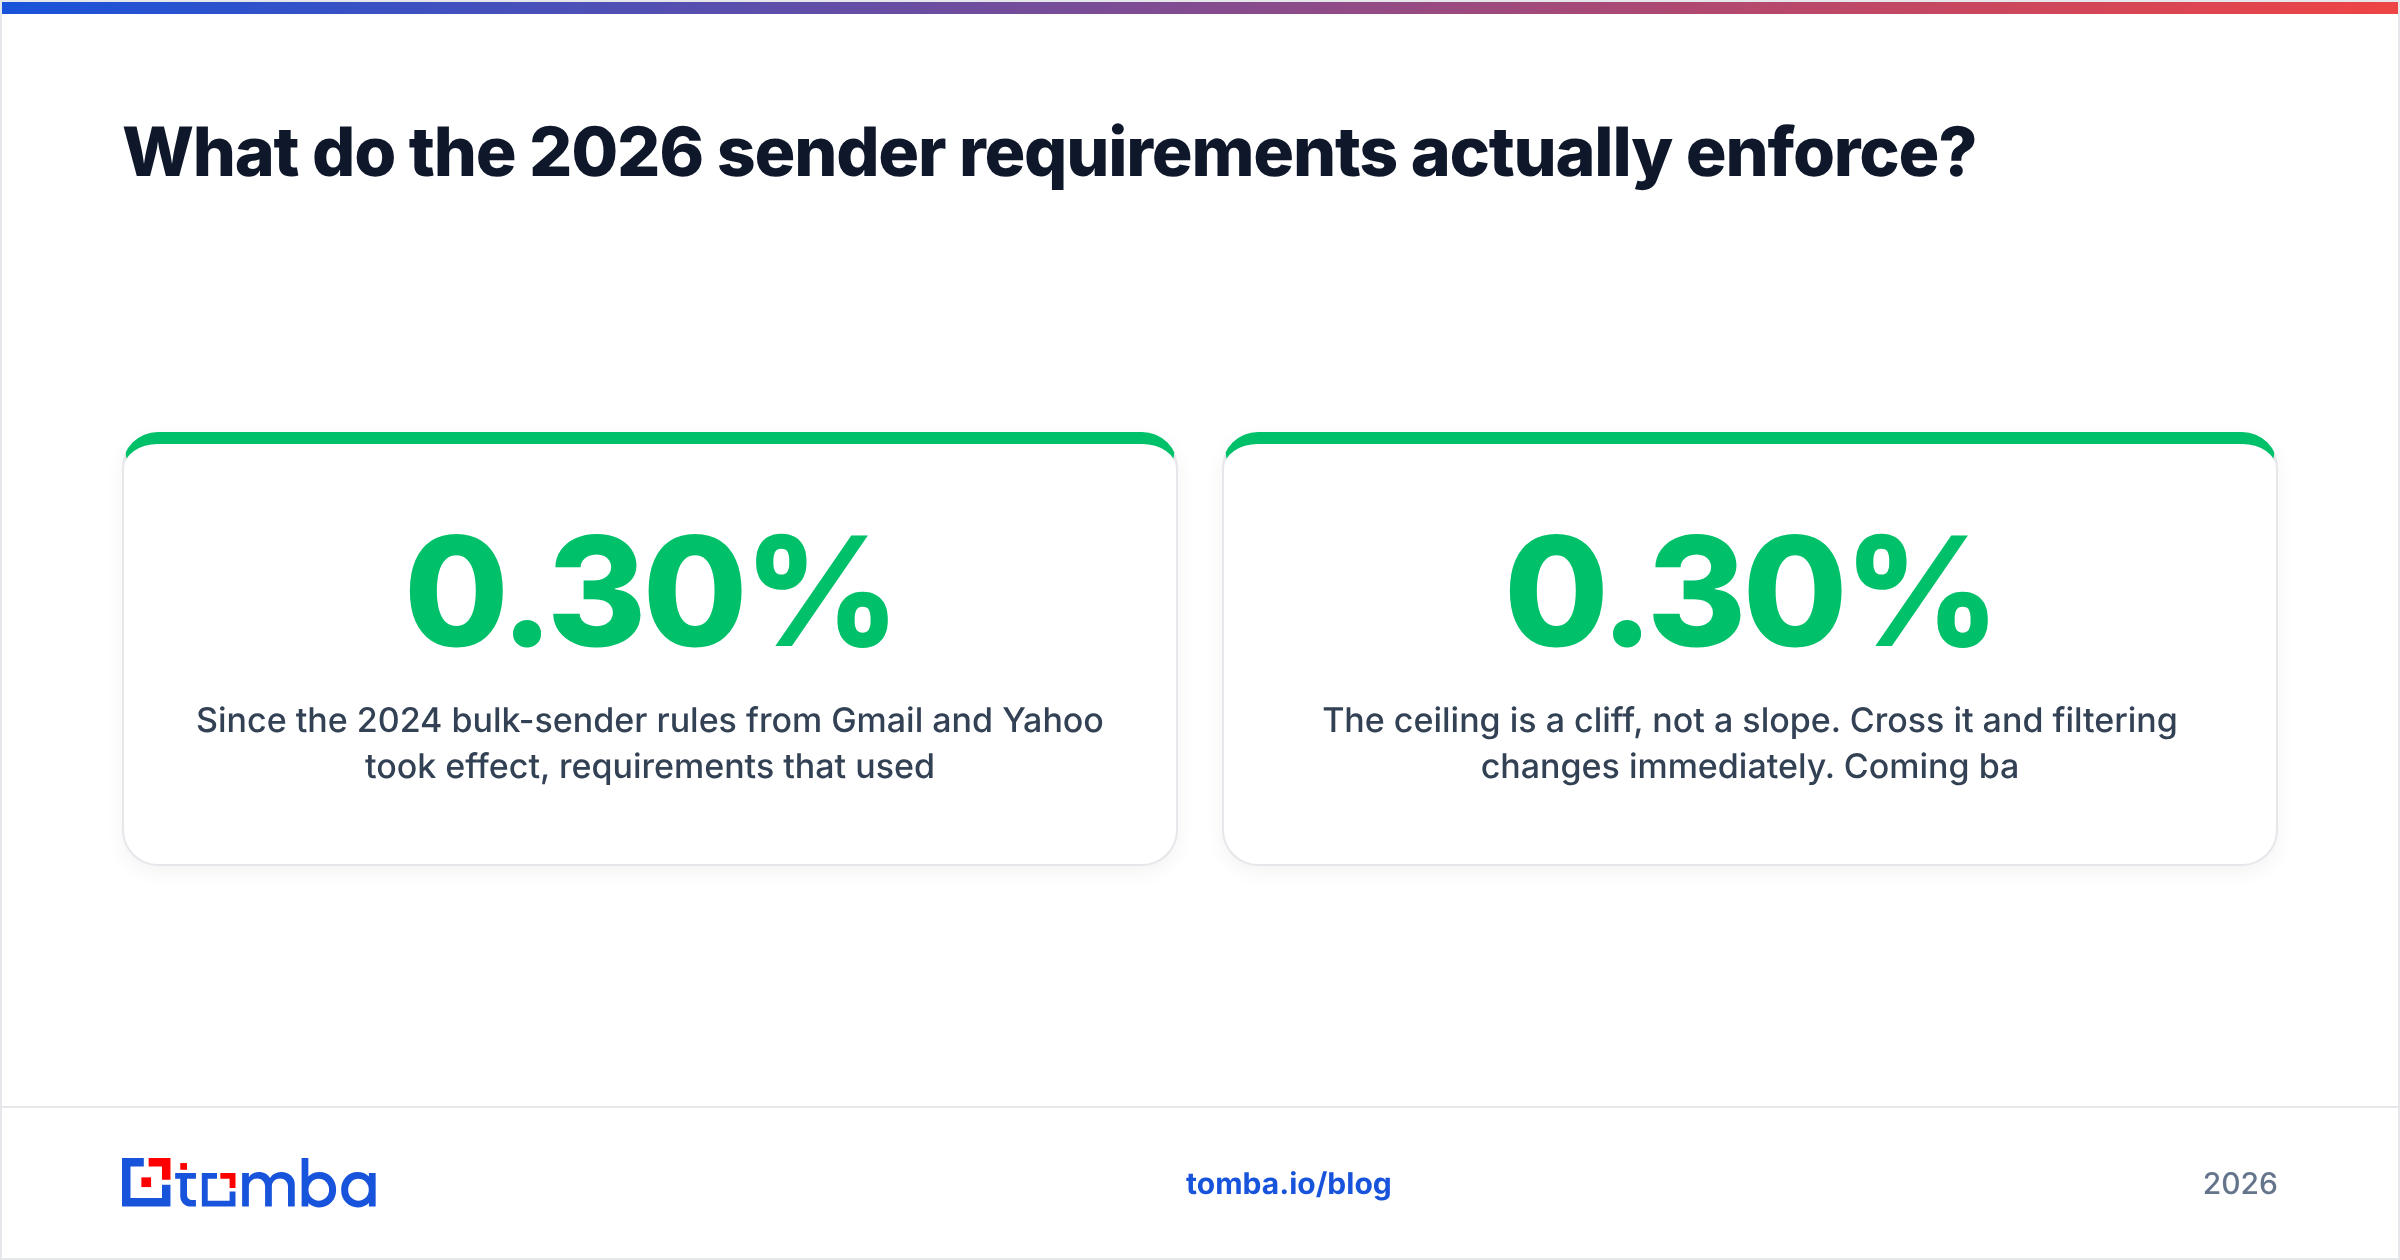
Since the 2024 bulk-sender rules from Gmail and Yahoo took effect, requirements that used to be "best practice" became pass/fail gates. If you send more than 5,000 messages a day to Gmail addresses, you must have SPF, DKIM, and DMARC configured, one-click unsubscribe honored within two days, and a spam complaint rate under 0.30% — with 0.10% named as the target. Google's own email sender guidelines spell out the thresholds, and Postmaster Tools is the only place you'll see your real complaint rate.
Three consequences most senders underestimate:
- The 0.30% ceiling is a cliff, not a slope. Cross it and filtering changes immediately. Coming back down takes far longer than going up.
- DMARC alignment trips people who "have DMARC." Publishing
p=nonesatisfies the letter of the requirement, but a policy that never aligns gives you no protection and no reporting value. DMARC works only when SPF or DKIM actually aligns with the visible From domain. - Per-recipient-domain reputation matters. Your Gmail placement and your Outlook placement are separate scores computed by separate systems. Averaging them hides the failure.
Which metrics predict inbox placement best?#
If you can only instrument five things, instrument these, in this order:
- Spam complaint rate (Postmaster). The highest-signal number available. Anything trending toward 0.10% needs intervention this week, not this quarter.
- Bounce rate segmented by domain. An overall 2% that's actually 0.4% everywhere except one 40%-bounce prospect domain is a data problem, not a reputation problem.
- Reply rate, not open rate. Privacy protection has made open tracking substantially noisier since 2021 — inflated by pre-fetching, suppressed by image blocking. Replies are the honest engagement signal, and providers appear to weight them accordingly.
- Seeded inbox placement. Run a seed list across Gmail, Outlook, Yahoo, and at least one corporate Microsoft 365 tenant before every major campaign. This is the only direct measurement of deliverability as opposed to delivery.
- Authentication pass rate over time. A DKIM key rotation that silently breaks alignment will tank placement days before any other metric moves.

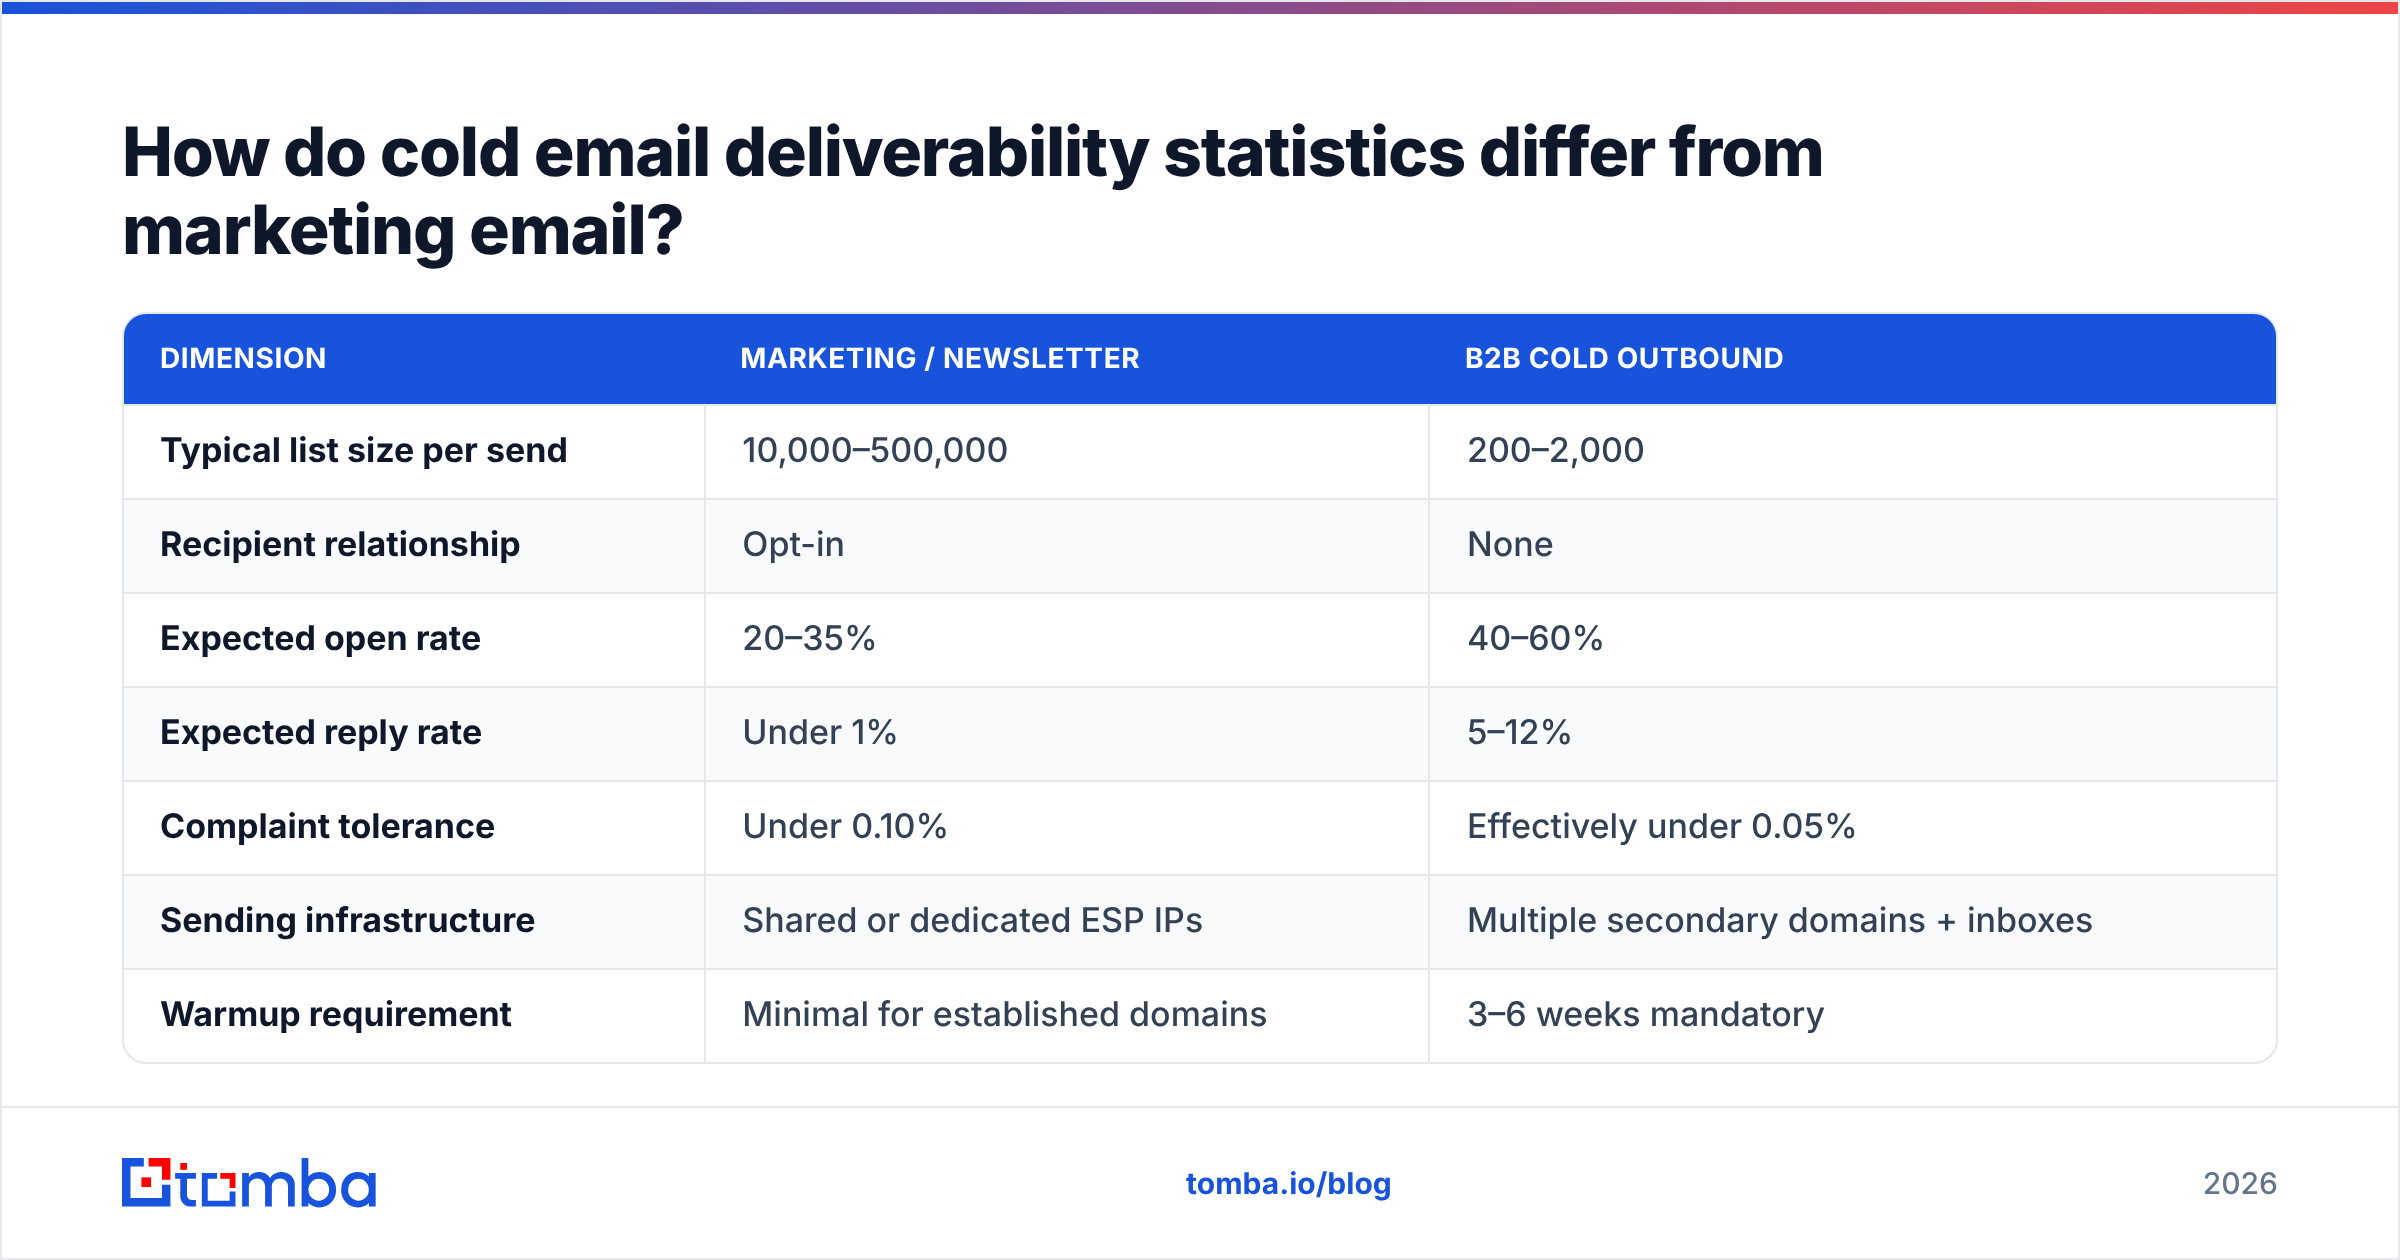
How do cold email deliverability statistics differ from marketing email?#
They differ enough that borrowing marketing benchmarks will mislead you badly.
| Dimension | Marketing / newsletter | B2B cold outbound |
|---|---|---|
| Typical list size per send | 10,000–500,000 | 200–2,000 |
| Recipient relationship | Opt-in | None |
| Expected open rate | 20–35% | 40–60% |
| Expected reply rate | Under 1% | 5–12% |
| Complaint tolerance | Under 0.10% | Effectively under 0.05% |
| Sending infrastructure | Shared or dedicated ESP IPs | Multiple secondary domains + inboxes |
| Warmup requirement | Minimal for established domains | 3–6 weeks mandatory |
| Primary failure mode | List fatigue | List quality + volume ramp |
Cold outbound gets less margin for error and needs higher engagement to survive, which is why per-inbox volume caps matter so much. Sending 30 messages a day from each of eight inboxes on separate secondary domains is materially safer than 240 from one — not because it's a trick, but because it matches the natural pattern of human sending. Use a warmup calculator to plan the ramp rather than eyeballing it.
Also worth naming: the B2B email data decay rate. Contact data degrades at roughly 22–30% per year, driven by job changes, company rebrands, and domain migrations. Any list you built more than two quarters ago is measurably worse than the day you built it. Aggregated marketing benchmarks across channels, including HubSpot's marketing statistics, consistently show the same pattern: freshness beats volume.
What benchmarks should you hold your team to?#
Set these as internal SLAs and review them weekly:
- Pre-send: 100% of addresses verified within 30 days of sending. No exceptions for "we got this from a good source."
- Bounce: under 2% per campaign, under 1% rolling 30-day. Pause any sequence that crosses 3%.
- Complaints: under 0.05% rolling. Alert at 0.03%.
- Authentication: 100% pass on SPF, DKIM, and DMARC, checked monthly and after any DNS change.
- Placement: seed-test quarterly at minimum, and before any campaign over 5,000 recipients.
- Volume: no more than a 20% week-over-week increase per sending domain.
Teams that hit those six numbers rarely have a deliverability crisis. Teams that miss two or more usually have one within a quarter.
How do you fix a deliverability problem the statistics say you have?#
Work backwards from the metric that broke.
If bounces spiked, stop sending, re-verify the entire remaining list in bulk, and resume at 30% of prior volume for two weeks. If complaints spiked, audit your targeting relevance and your unsubscribe path — complaints are usually a "wrong person" problem, not a "wrong copy" problem. If placement dropped while bounces and complaints stayed clean, check authentication first, then link domains: a shortener or tracking domain with poor reputation drags the whole message down. If replies collapsed without any other metric moving, you're probably in spam at one specific provider — seed-test to find which.
The pattern across all four: measure the specific thing, don't rewrite the subject line and hope. Content-level fixes solve maybe 15% of real deliverability failures. The rest are data, authentication, or volume.
Where should you start?#
Fix the input before you optimise anything downstream. The most reliable single move available to most teams is replacing guessed or scraped addresses with verified ones — it moves bounce rate, complaint rate, and placement simultaneously, and it's the cheapest intervention on the list.
The Tomba Email Finder returns verified professional addresses by domain, name, or company, with confidence scoring on every result, so your sequencer only ever sees addresses that are likely to resolve. The free tier includes 25 searches a month; paid plans start at $49/mo, with Growth at $99/mo for teams running continuous outbound. Build the list clean, and the deliverability statistics take care of themselves.
Related guides#
Ready to find emails that actually work?
Join 150,000+ professionals who stopped guessing and started sending. Free credits on signup — no credit card required.
Get the Tomba newsletter
Practical outbound tactics and product updates — once every two weeks.
About the author