Email Open Rate Average in 2026: Benchmarks by Industry
The reported email open rate average jumped after 2021 — and most of that jump was fake. Here are MPP-adjusted 2026 benchmarks by industry, by email type, and the three fixes that actually move the number.
TL;DR
- The blended email open rate average across industries sits around 34–42% in 2026 for marketing email, and roughly 35–50% for well-targeted cold outbound — but both numbers are inflated by machine opens.
- Apple's Mail Privacy Protection (MPP) and similar scanners auto-fire the tracking pixel. Depending on your audience, 25–60% of your "opens" are robots.
- Industry variance is bigger than tactic variance: nonprofits and education routinely clear 45%, while retail and daily-deal senders sit in the mid-20s.
- The three inputs that actually move opens, in order: list hygiene → sender reputation → subject line. Most teams work that list backwards.
- Open rate is now a diagnostic, not a KPI. Track reply rate and pipeline; use open rate to catch deliverability failures early.
What is the email open rate average in 2026?#
Short answer: around 34–42% for marketing email and 35–50% for targeted cold outbound — and you should mentally discount both by a third.
Here's why the honest answer needs a range instead of a single number. Aggregate benchmark reports pool wildly different senders: a nonprofit newsletter with a 5-year-old opt-in list and a retail flash-sale blast to a purchased database both land in the same average. The open rate you should compare yourself to depends almost entirely on how the address got on your list and what the recipient expects from you.
The second complication is measurement. An "open" is not a human action your email client reports. It's a 1×1 transparent image loaded from a tracking server. If anything loads that image — a privacy proxy, a security scanner, a preview pane — your ESP records an open. Since Apple shipped Mail Privacy Protection in late 2021, that "anything" includes a large share of the consumer inbox by default.
So when someone tells you their newsletter gets a 52% open rate, the useful follow-up isn't "how?" It's "what percentage of your list is on Apple Mail?"
Why did Apple's Mail Privacy Protection break open rates?#
MPP pre-fetches remote images through a proxy the moment an email arrives, whether or not the recipient ever looks at it. Every one of those pre-fetches registers as an open at a randomized IP, at a time that has nothing to do with human behavior.
The practical effects:
- Inflated open rates. Lists heavy on Apple Mail users saw reported opens climb 10–20 percentage points overnight in 2021–2022 without any change in actual engagement.
- Useless open timestamps. "Send at the hour your audience opens" optimization broke, because MPP fires on delivery, not on read.
- Broken open-based automation. Re-engagement flows triggered by "didn't open in 90 days" now skip people who genuinely never read anything.
- Distorted A/B tests. If half your list is proxied, a subject-line test needs a much larger sample to detect a real difference.
- Corrupted list-hygiene rules. Sunsetting non-openers no longer identifies dead addresses reliably.
Google, Yahoo, and most corporate security gateways add their own layer of automated fetching. Link-scanning appliances in B2B environments click links too, which means click rates in enterprise-heavy segments carry similar noise.
The fix isn't to stop tracking. It's to segment your reporting: pull an Apple-Mail-only cohort and a non-Apple cohort, and watch the two lines separately. When only one moves, you've learned something. When both move together, it's usually deliverability.
What is a good open rate by industry?#
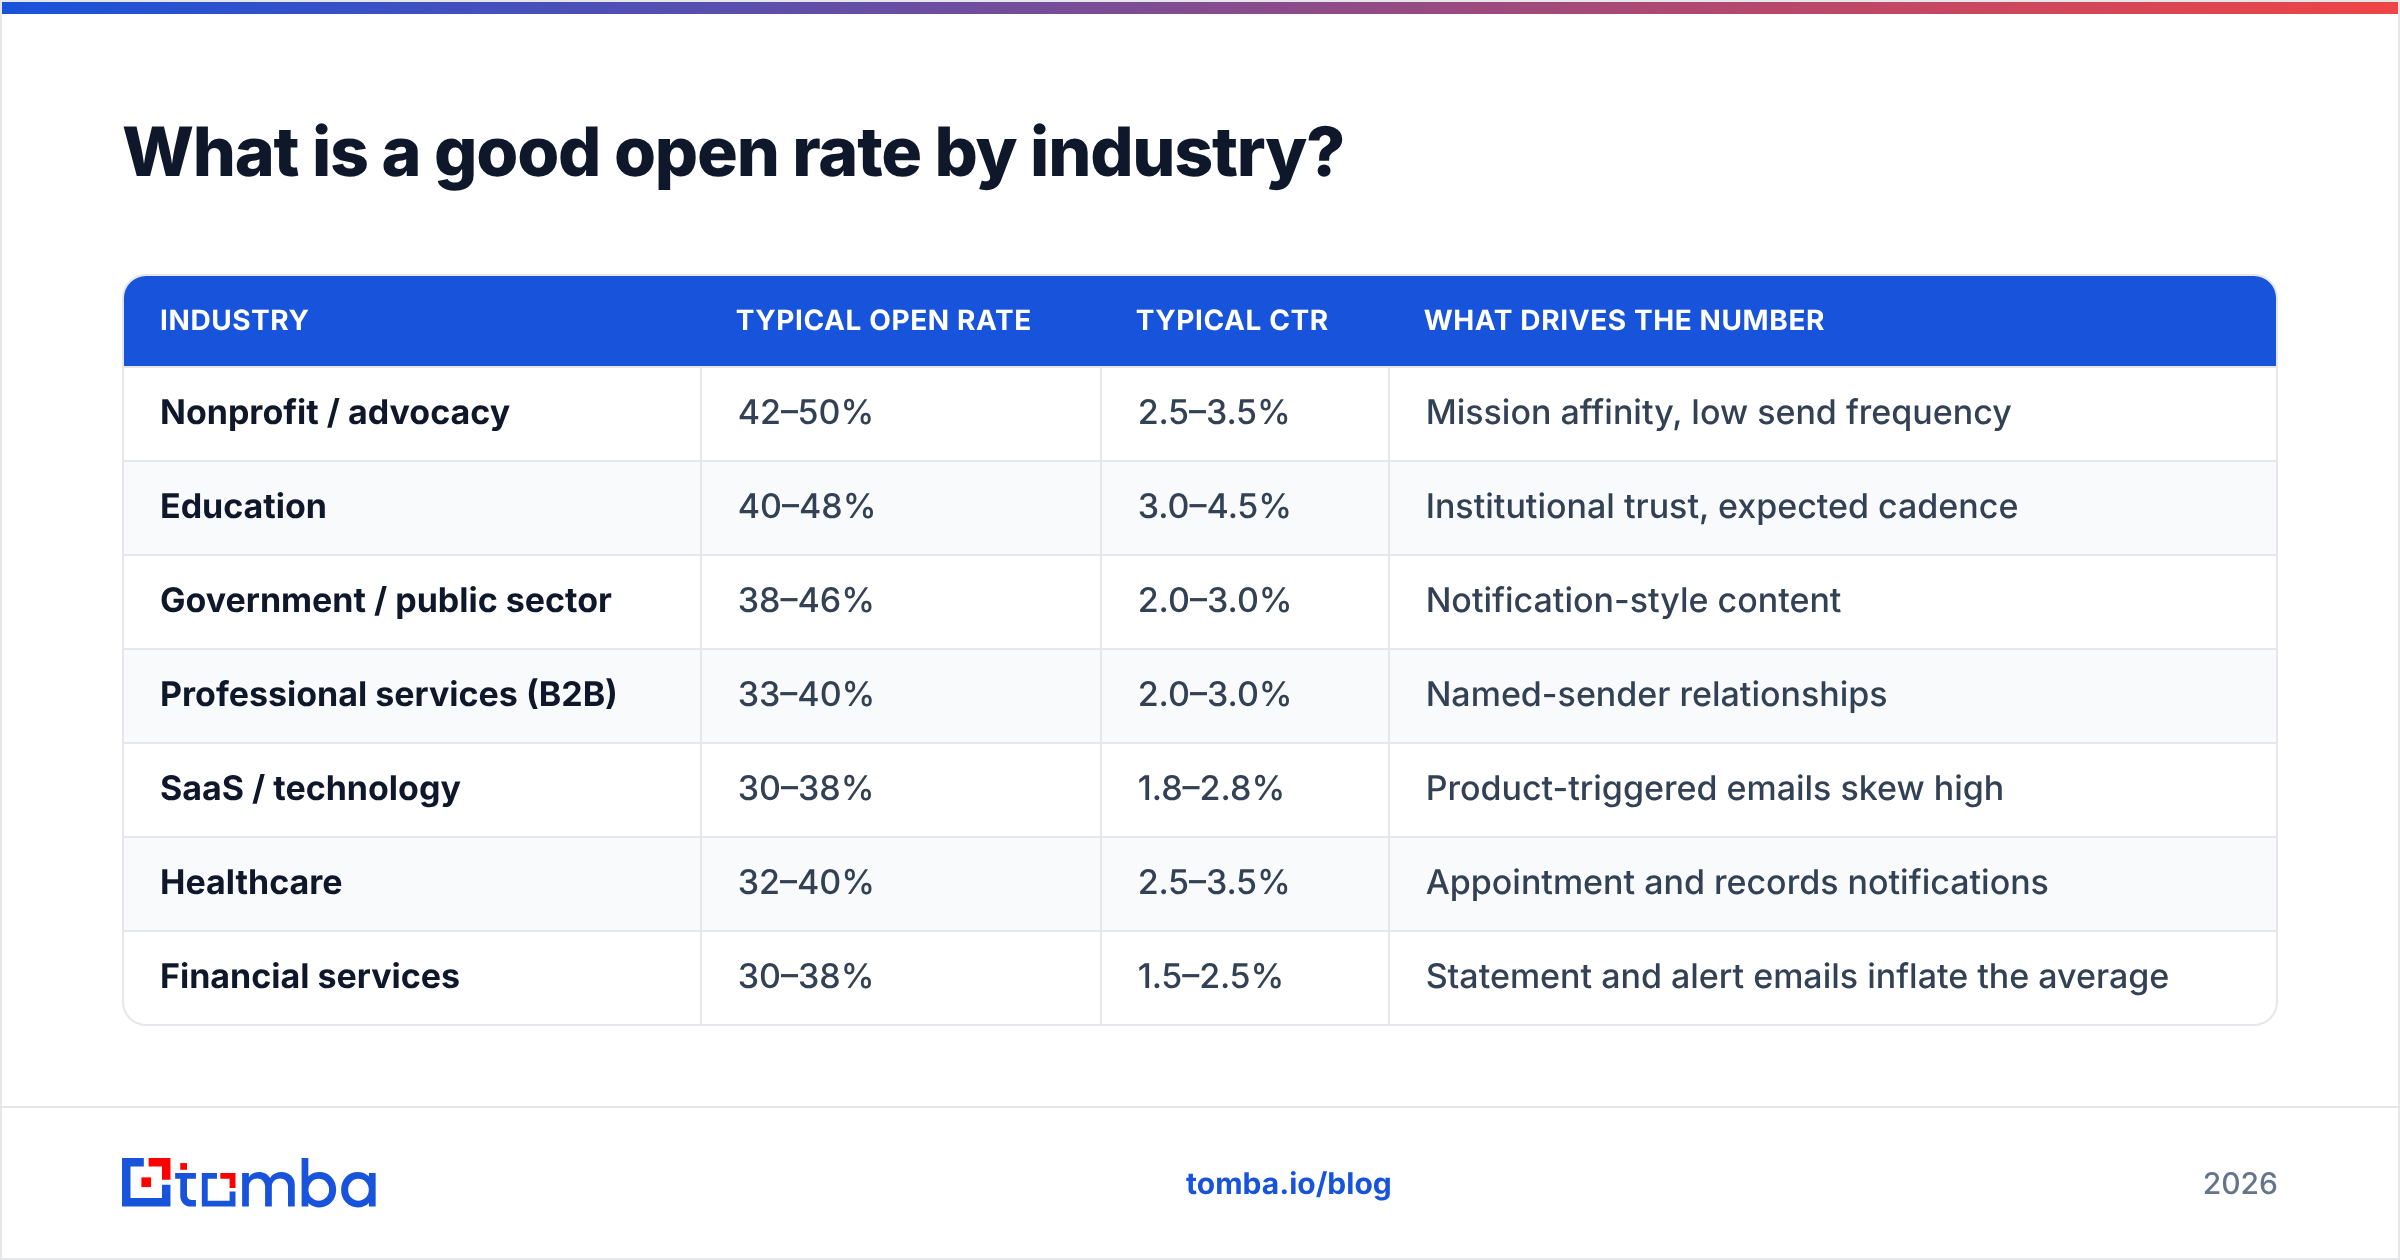
Use the table below as a rough sanity check, not a scoreboard. These are blended ranges for permission-based marketing email, which means they include machine opens. Subtract roughly 10–15 points to estimate human opens for consumer-heavy lists, and 5–10 points for B2B lists behind corporate scanners.
| Industry | Typical open rate | Typical CTR | What drives the number |
|---|---|---|---|
| Nonprofit / advocacy | 42–50% | 2.5–3.5% | Mission affinity, low send frequency |
| Education | 40–48% | 3.0–4.5% | Institutional trust, expected cadence |
| Government / public sector | 38–46% | 2.0–3.0% | Notification-style content |
| Professional services (B2B) | 33–40% | 2.0–3.0% | Named-sender relationships |
| SaaS / technology | 30–38% | 1.8–2.8% | Product-triggered emails skew high |
| Healthcare | 32–40% | 2.5–3.5% | Appointment and records notifications |
| Financial services | 30–38% | 1.5–2.5% | Statement and alert emails inflate the average |
| Real estate | 30–37% | 1.5–2.5% | Listing alerts, high unsubscribe churn |
| Manufacturing / industrial | 28–35% | 1.5–2.5% | Small lists, long cycles |
| Retail / e-commerce | 24–32% | 1.0–2.0% | High frequency, promotional fatigue |
| Travel / hospitality | 25–33% | 1.2–2.2% | Seasonal spikes, heavy discounting |
| Daily deals / coupons | 20–28% | 1.0–1.8% | Volume strategy, low per-send attention |
Two patterns fall out of this. First, the highest open rates belong to senders whose email is functionally a notification — a class schedule, a statement, a donation receipt. Second, frequency is the strongest negative correlate. Retail brands sending five times a week are not worse marketers than nonprofits sending monthly; they're paying an attention tax for volume, and they usually make more money doing it.
If you want an external cross-check, Mailchimp's public benchmark data and HubSpot's marketing statistics roundup both publish periodically updated industry cuts. Read them as directional. Neither can tell you what share of their sample was MPP-proxied.
How do cold email open rates compare to marketing email?#
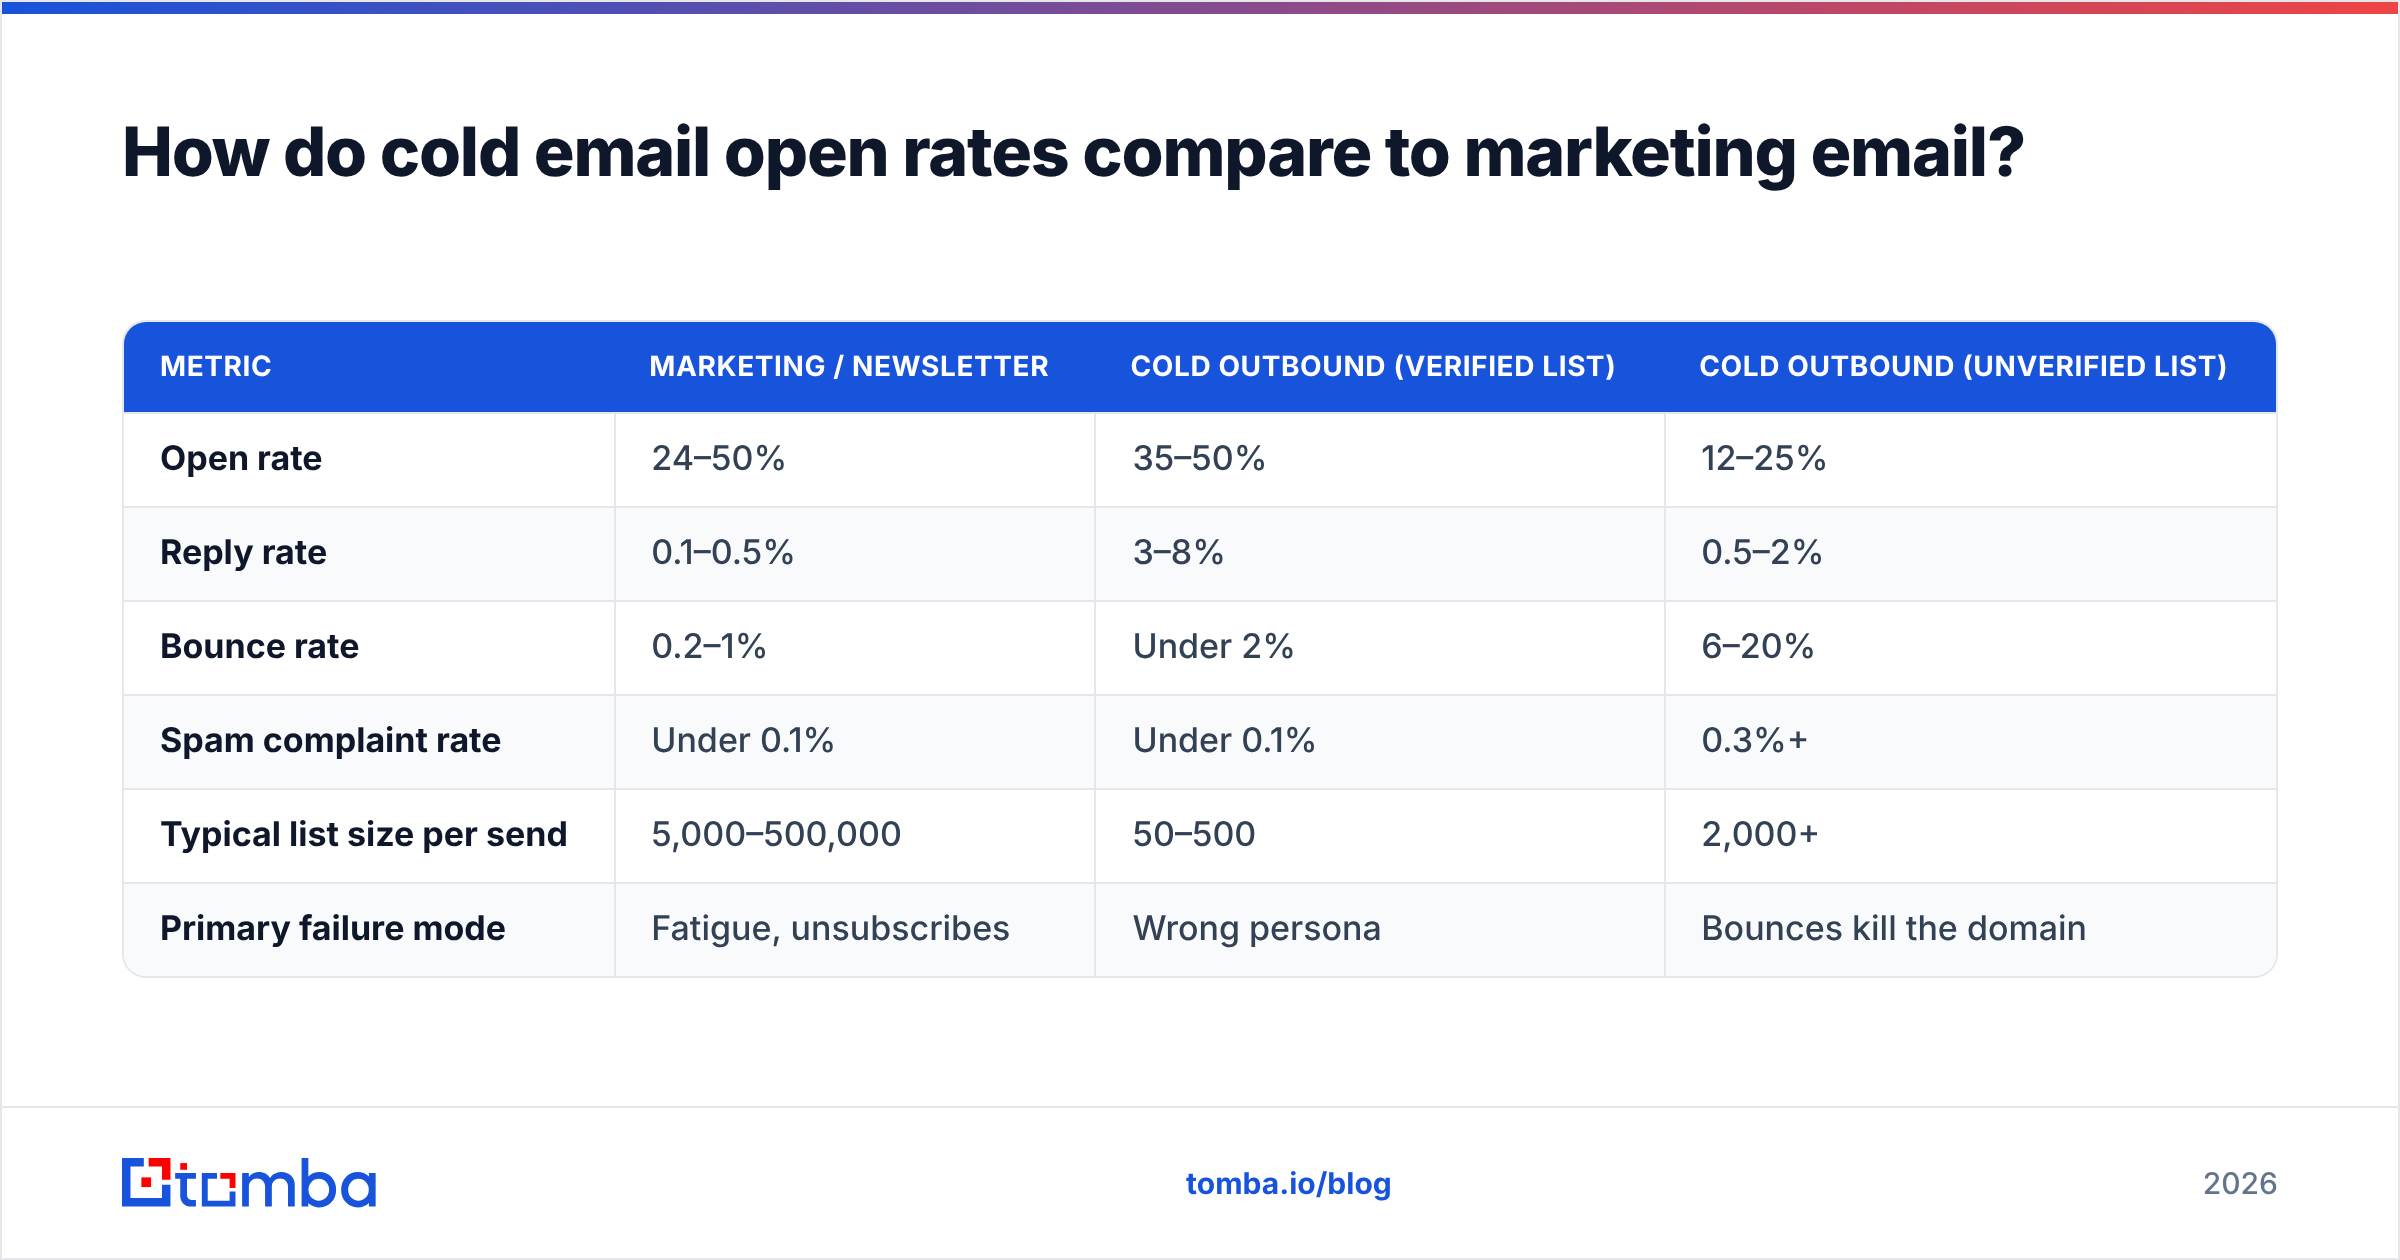
Cold outbound plays by different rules. There's no opt-in, the list is usually smaller, and personalization is per-contact rather than per-segment. A well-run cold campaign to a verified, tightly targeted list often outperforms newsletter open rates — and a sloppy one gets crushed.
| Metric | Marketing / newsletter | Cold outbound (verified list) | Cold outbound (unverified list) |
|---|---|---|---|
| Open rate | 24–50% | 35–50% | 12–25% |
| Reply rate | 0.1–0.5% | 3–8% | 0.5–2% |
| Bounce rate | 0.2–1% | Under 2% | 6–20% |
| Spam complaint rate | Under 0.1% | Under 0.1% | 0.3%+ |
| Typical list size per send | 5,000–500,000 | 50–500 | 2,000+ |
| Primary failure mode | Fatigue, unsubscribes | Wrong persona | Bounces kill the domain |
That last row is the one people underweight. In marketing email, a bad campaign wastes a send. In cold outbound, a bad list damages the sending domain — and the damage carries over to every campaign that follows. Mailbox providers read a high bounce rate as a signal you scraped or bought your data, and they throttle you accordingly. That's why the single highest-leverage change in most cold programs isn't the copy; it's running the list through an email verifier before the first send.
Google spells this out directly in its Postmaster Tools guidance for bulk senders: keep spam complaints under 0.3%, authenticate with SPF/DKIM/DMARC, and make unsubscribing trivial. Miss those and your open rate becomes a rounding error, no matter how good the subject line is.
How do you calculate open rate correctly?#
The formula everyone uses:
Open rate = (unique opens ÷ delivered emails) × 100
Two mistakes show up constantly:
- Dividing by emails sent instead of delivered. If you sent 10,000 and 800 bounced, your denominator is 9,200. Using 10,000 understates your rate and hides the bounce problem.
- Using total opens instead of unique opens. Total opens count the same person opening four times. It's a useful engagement signal; it is not an open rate.
For a cleaner read in the MPP era, calculate three numbers instead of one:
- Raw open rate — the headline number your ESP shows. Use it only for trend lines against your own history.
- Non-Apple open rate — filter to recipients not on Apple Mail. Noisier sample, far more honest signal.
- Click-to-delivered rate — clicks divided by delivered. Bots inflate this too in enterprise environments, but far less than they inflate opens.
Then anchor everything to reply rate for outbound and conversion rate for marketing. Those are the only two numbers a proxy server can't fake.
What actually moves your open rate?#
In priority order, with realistic expected impact:
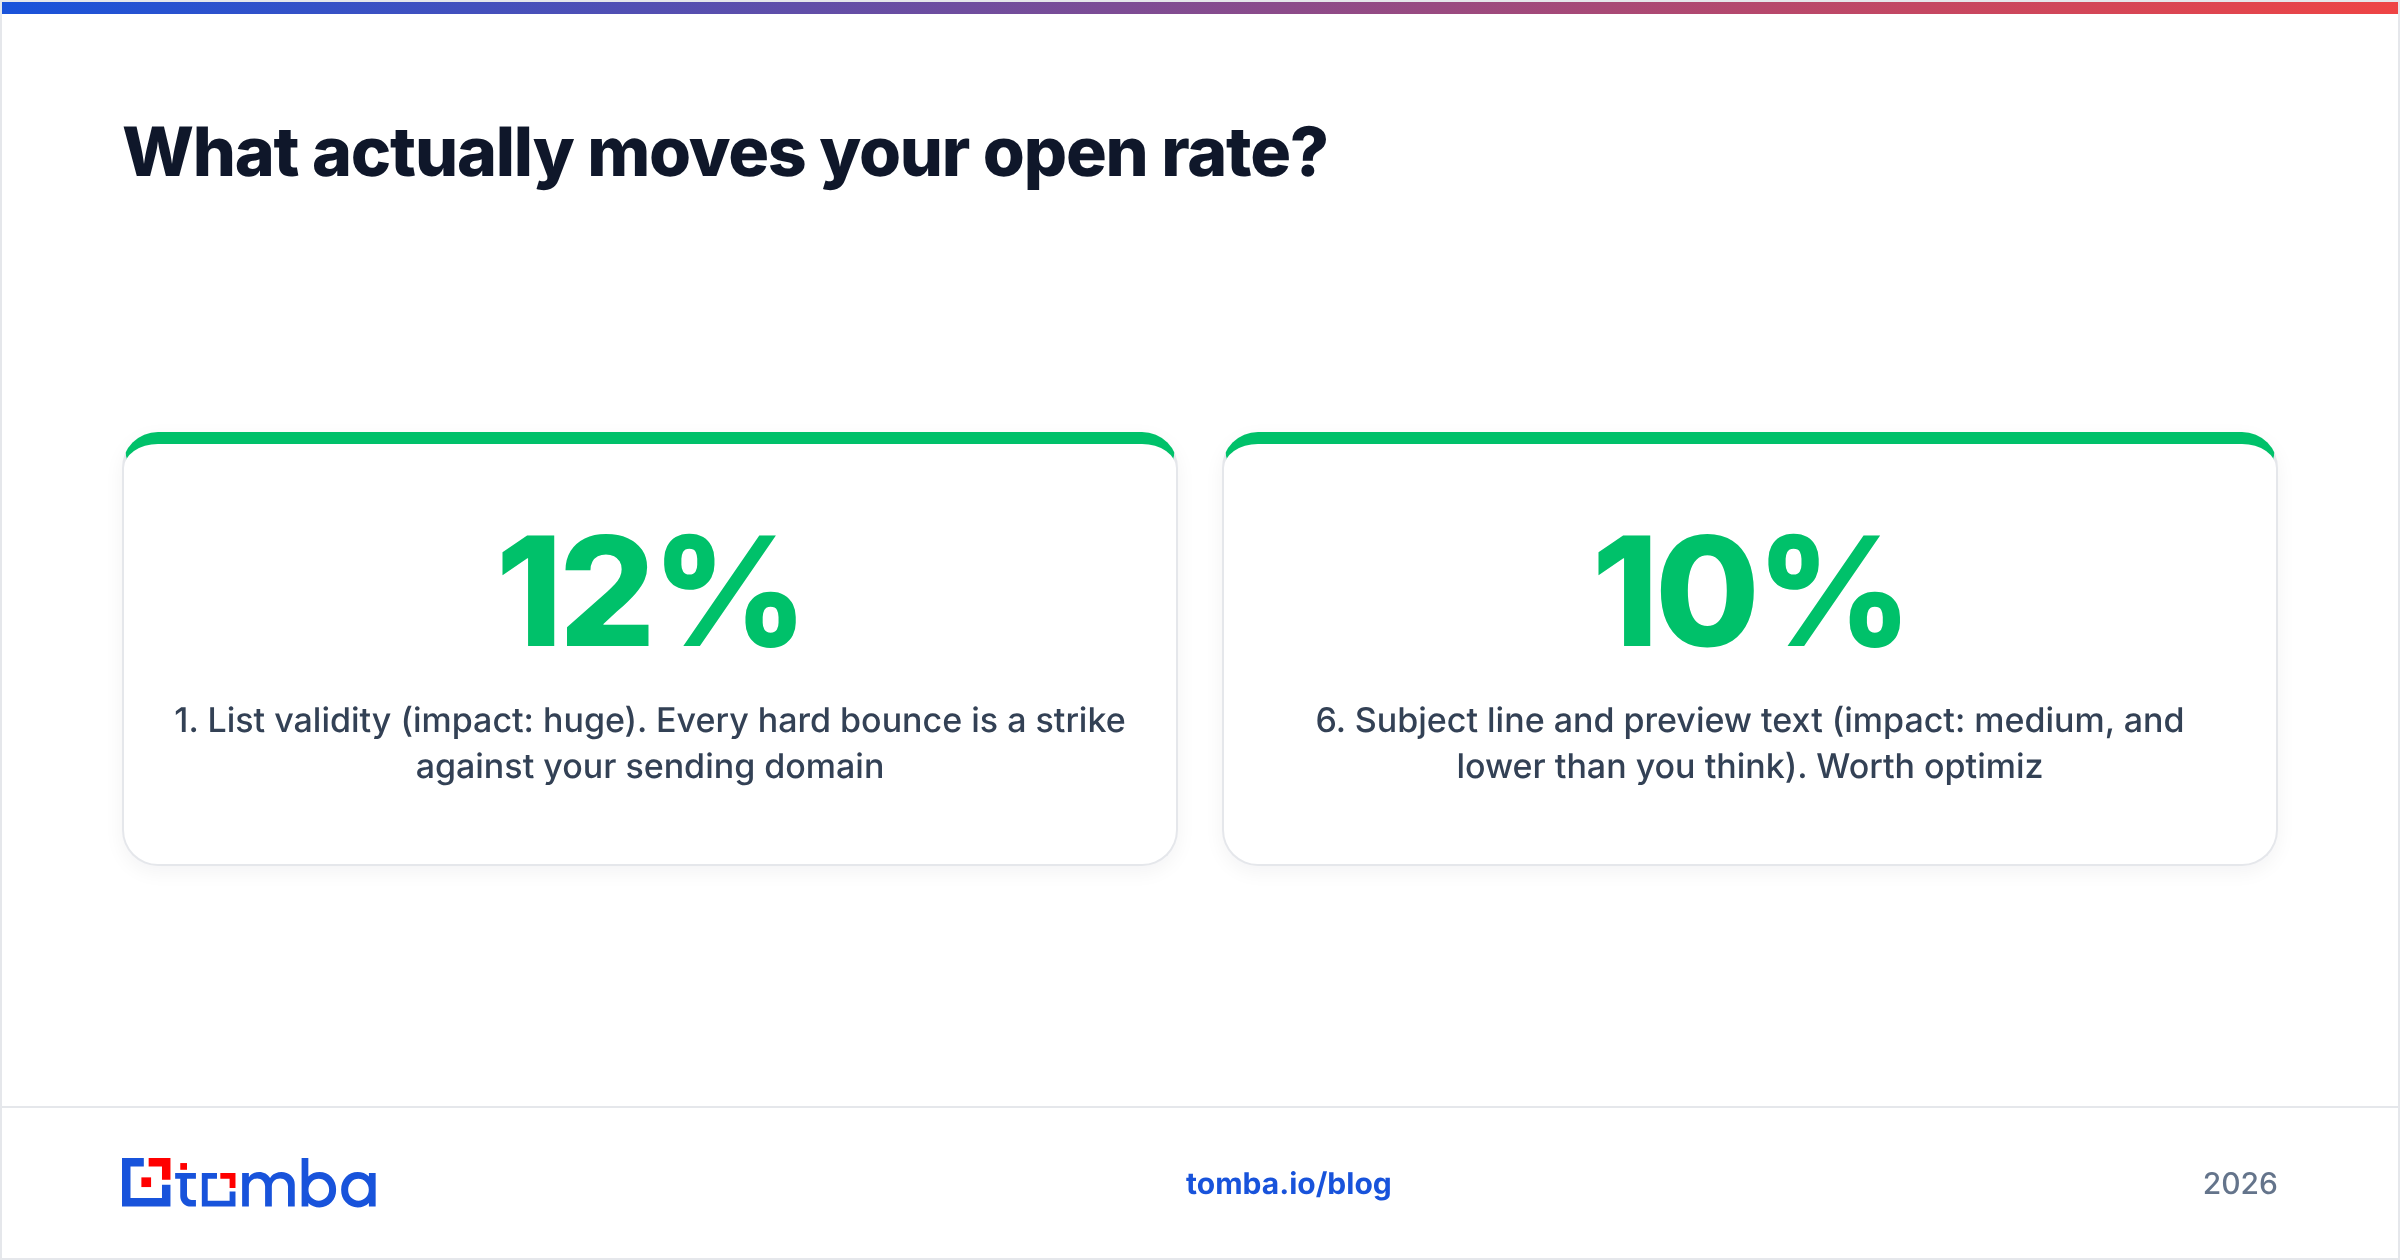
- List validity (impact: huge). Every hard bounce is a strike against your sending domain. Dropping bounce rate from 12% to under 2% typically lifts open rate 10–20 points on subsequent sends, because you stop getting throttled. This is not a copy problem — it's a data problem. Verify before you send, and re-verify quarterly; B2B data decays roughly 2–3% per month as people change jobs.
- Authentication and infrastructure (impact: huge). SPF, DKIM, and a DMARC policy are table stakes in 2026. Missing DMARC on a bulk send to Gmail or Yahoo can send the whole campaign to spam. Check your SPF record before you debug anything else.
- Sender reputation and warmup (impact: high). New domains need 3–6 weeks of ramping. Going from zero to 500 sends a day on a fresh domain is the fastest way to burn it. Model the ramp with a warmup calculator rather than guessing.
- Targeting relevance (impact: high). The right message to the wrong persona reads as spam. Narrowing your ICP usually beats any subject-line rewrite — a 200-contact list of exact-fit prospects will out-open a 2,000-contact approximation every time.
- From-name and sender identity (impact: medium). A real person's name at a recognizable company beats "Marketing Team" consistently. In B2B, recipients scan the sender before the subject.
- Subject line and preview text (impact: medium, and lower than you think). Worth optimizing, but it's the last 10%, not the first 50%. Run candidates through a subject line tester and move on.
Notice that four of the six items are infrastructure and data. The industry spends most of its attention on item six.

Should you still track open rates at all?#
Yes — but demote it. Treat open rate the way a mechanic treats a temperature gauge: it won't tell you the engine is fast, but a sudden spike means stop driving.
Use open rate for:
- Deliverability alarms. A 40% → 12% drop across all segments almost always means a blocklist, a broken DNS record, or a reputation hit. Nothing else moves that fast.
- Domain-level comparisons. If Gmail opens hold steady while Outlook opens collapse, you have a Microsoft filtering problem, not a content problem.
- Directional subject testing on large lists, with the Apple cohort excluded.
Don't use open rate for:
- Sunsetting subscribers — use clicks and site activity instead.
- Lead scoring — an MPP open is worth nothing, and scoring it pollutes your pipeline data.
- Executive reporting — no one upstairs should be looking at a metric a proxy server can inflate 20 points.
The teams getting this right report a small stack: delivered rate, bounce rate, reply rate, meetings booked. Open rate sits in the diagnostics panel, not the dashboard.
How do you diagnose a falling open rate?#
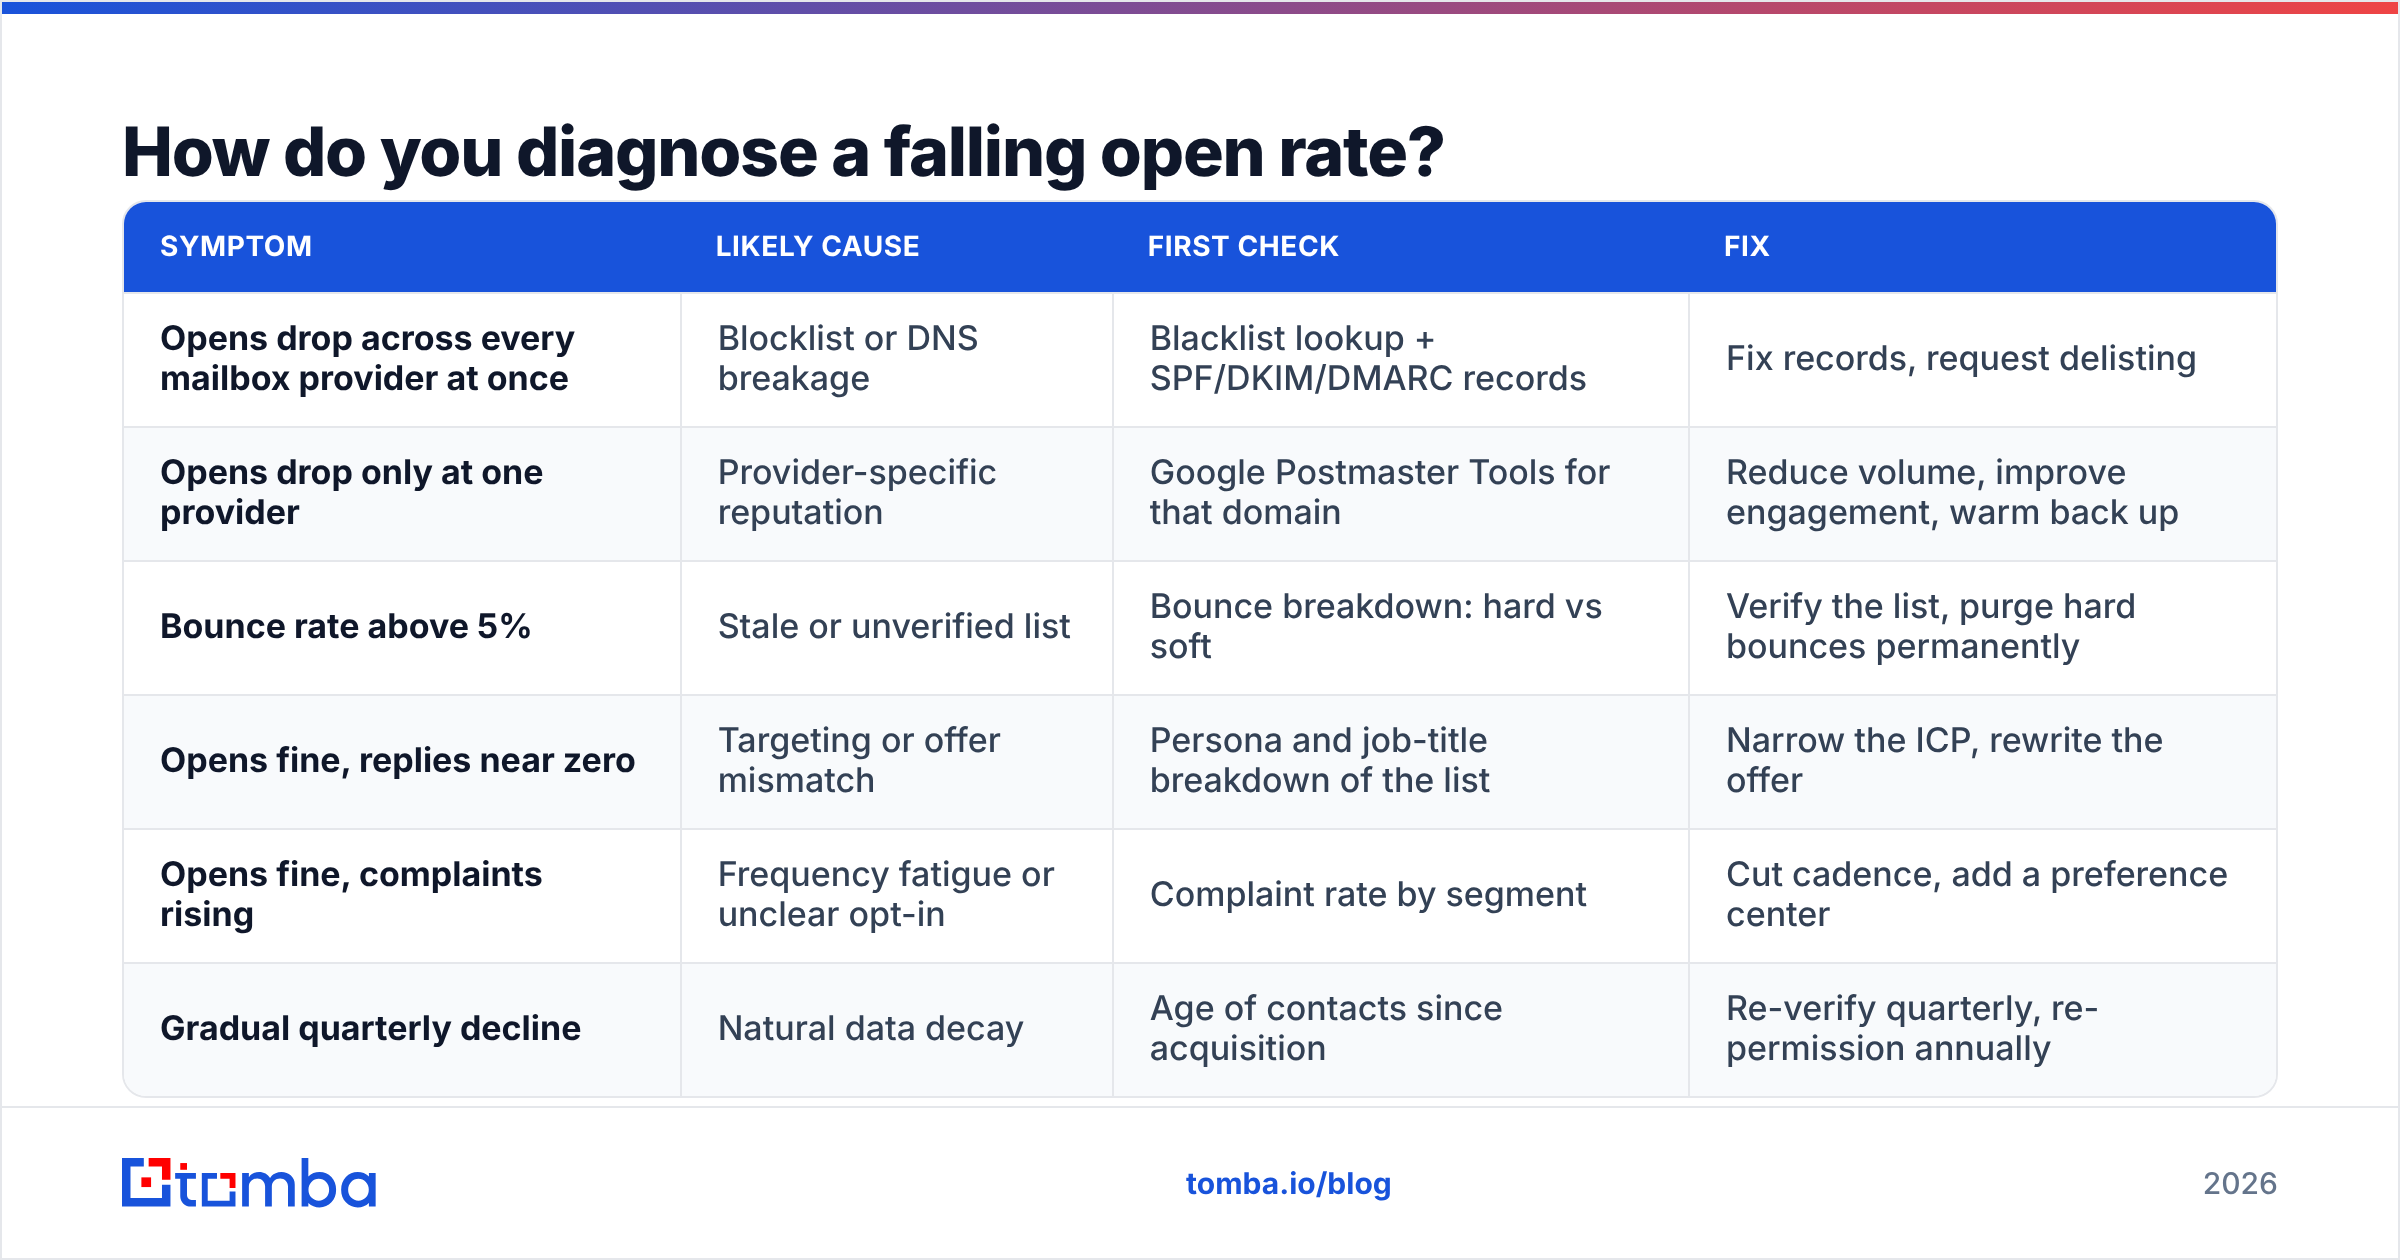
Work top-down. Each step rules out a whole class of cause before you touch the copy.
| Symptom | Likely cause | First check | Fix |
|---|---|---|---|
| Opens drop across every mailbox provider at once | Blocklist or DNS breakage | Blacklist lookup + SPF/DKIM/DMARC records | Fix records, request delisting |
| Opens drop only at one provider | Provider-specific reputation | Google Postmaster Tools for that domain | Reduce volume, improve engagement, warm back up |
| Bounce rate above 5% | Stale or unverified list | Bounce breakdown: hard vs soft | Verify the list, purge hard bounces permanently |
| Opens fine, replies near zero | Targeting or offer mismatch | Persona and job-title breakdown of the list | Narrow the ICP, rewrite the offer |
| Opens fine, complaints rising | Frequency fatigue or unclear opt-in | Complaint rate by segment | Cut cadence, add a preference center |
| Gradual quarterly decline | Natural data decay | Age of contacts since acquisition | Re-verify quarterly, re-permission annually |
One nuance worth flagging: if your bounce rate is high because a large slice of your list sits on catch-all domains, standard verification returns "unknown" rather than a clean verdict. Those addresses aren't automatically bad — they just need a different method. A dedicated catch-all verifier resolves a meaningful share of them instead of forcing you to either delete good contacts or risk the bounces.
What's a realistic target for your own list?#
Set the target from your own baseline, not from a benchmark report. A practical approach:
- Take your last 90 days of sends and compute the median open rate. That's your baseline.
- Set a 90-day goal of +5 points, driven by list hygiene and authentication first.
- Set a floor, not just a ceiling. Any campaign landing more than 10 points below baseline triggers the diagnostic table above.
- Track reply rate in parallel. If open rate rises while reply rate falls, you optimized for curiosity gaps and got clicks from people who feel tricked. That's a net loss.
For cold outbound specifically, a verified list of 200 exact-fit prospects hitting 45% opens and 6% replies beats a 5,000-contact spray at 20% and 0.8% on every metric that ends in revenue — and it doesn't cost you the domain.
Where should you start?#
Start with the denominator, not the subject line. Most open-rate problems are bounce problems wearing a costume, and bounce problems come from unverified data.
If you're building outbound lists from scratch, Tomba's Email Finder returns verified professional addresses by domain, name, or company, with a confidence score on every result — so the list you send to is clean before it touches your sending domain rather than after. The free tier covers 25 searches a month for testing the workflow; paid plans start at $49/mo, and you can compare the tiers on the Tomba pricing page. Get the data right, then argue about subject lines.
Related guides#
Ready to find emails that actually work?
Join 150,000+ professionals who stopped guessing and started sending. Free credits on signup — no credit card required.
Get the Tomba newsletter
Practical outbound tactics and product updates — once every two weeks.
About the author