Why Email Open Rates Are Declining (And What to Track in 2026)
Open rates stopped being a metric in 2021 and nobody updated their dashboards. Here's what actually broke, what your numbers really mean now, and the five signals that replaced them.
Seeing email open rates declining across every campaign you send? The metric broke before the channel did. Here is what changed, and what to watch instead.
TL;DR
You are seeing email open rates declining on paper and inflating in reality at the same time. Apple Mail pre-loads tracking pixels. Gmail proxies images. Privacy-first clients block them outright. The number on your dashboard is part bot, part prefetch, part human.
Volume is the bigger driver. Inbox providers tightened bulk-sender rules in 2024 and have kept tightening. Fewer messages now reach the primary tab.
Open rate is no longer a KPI. It is a smoke alarm. Use it to spot sudden drops, not to judge campaign quality.
Track these instead: reply rate, positive reply rate, bounce rate, spam complaint rate, and meetings booked per 100 verified contacts.
Most open rate problems are list problems. Bad data drives bounces. Bounces hurt your sender reputation. That is where real delivery loss begins.
Why are email open rates declining across the board?#
Because the measurement broke before the channel did. Then the channel got harder too.
Open rate was always a fiction with a useful correlation. It works by hiding a 1×1 image in your email. When the reader's client loads that image from your server, you log an "open." No image load, no open. Ten loads, ten opens.
Three things broke that, in order:
Apple Mail Privacy Protection (MPP, September 2021) — Apple routes images through its own proxy. It loads them whether or not the user opens the message. If much of your list uses Apple Mail on any device, a chunk of your "opens" are machines. Apple's own privacy documentation says plainly that this hides IP and read activity from senders.
Gmail image proxying and tab filtering — Google caches images on its own servers. It has also tuned Promotions and Updates routing hard. Mail that lands in Promotions gets opened far less often than mail in the primary tab.
Security scanners and link protection — Company gateways like Microsoft Defender and Proofpoint open links and fetch images before delivery. That creates phantom opens and phantom clicks, often within seconds of send.
So you get an odd mix. Bots and prefetches push the number up. Blocked pixels push it down. Real reach falls at the same time. For most teams the line trends down and stays noisy. That is email open rates declining in the report and in truth, for two unrelated reasons.

The second layer is volume. In February 2024, Google and Yahoo shipped shared rules for bulk senders. You need authenticated mail (SPF, DKIM, DMARC), one-click unsubscribe, and a spam complaint rate under 0.3%. Those rules never relaxed. Every mailbox provider now assumes them. Say you send cold outreach from a domain with a half-built SPF record and no DMARC policy. You do not have a metric problem. You have a delivery problem that looks like one.
What does an open rate actually measure in 2026?#
It measures that an image was fetched by something. That is all.
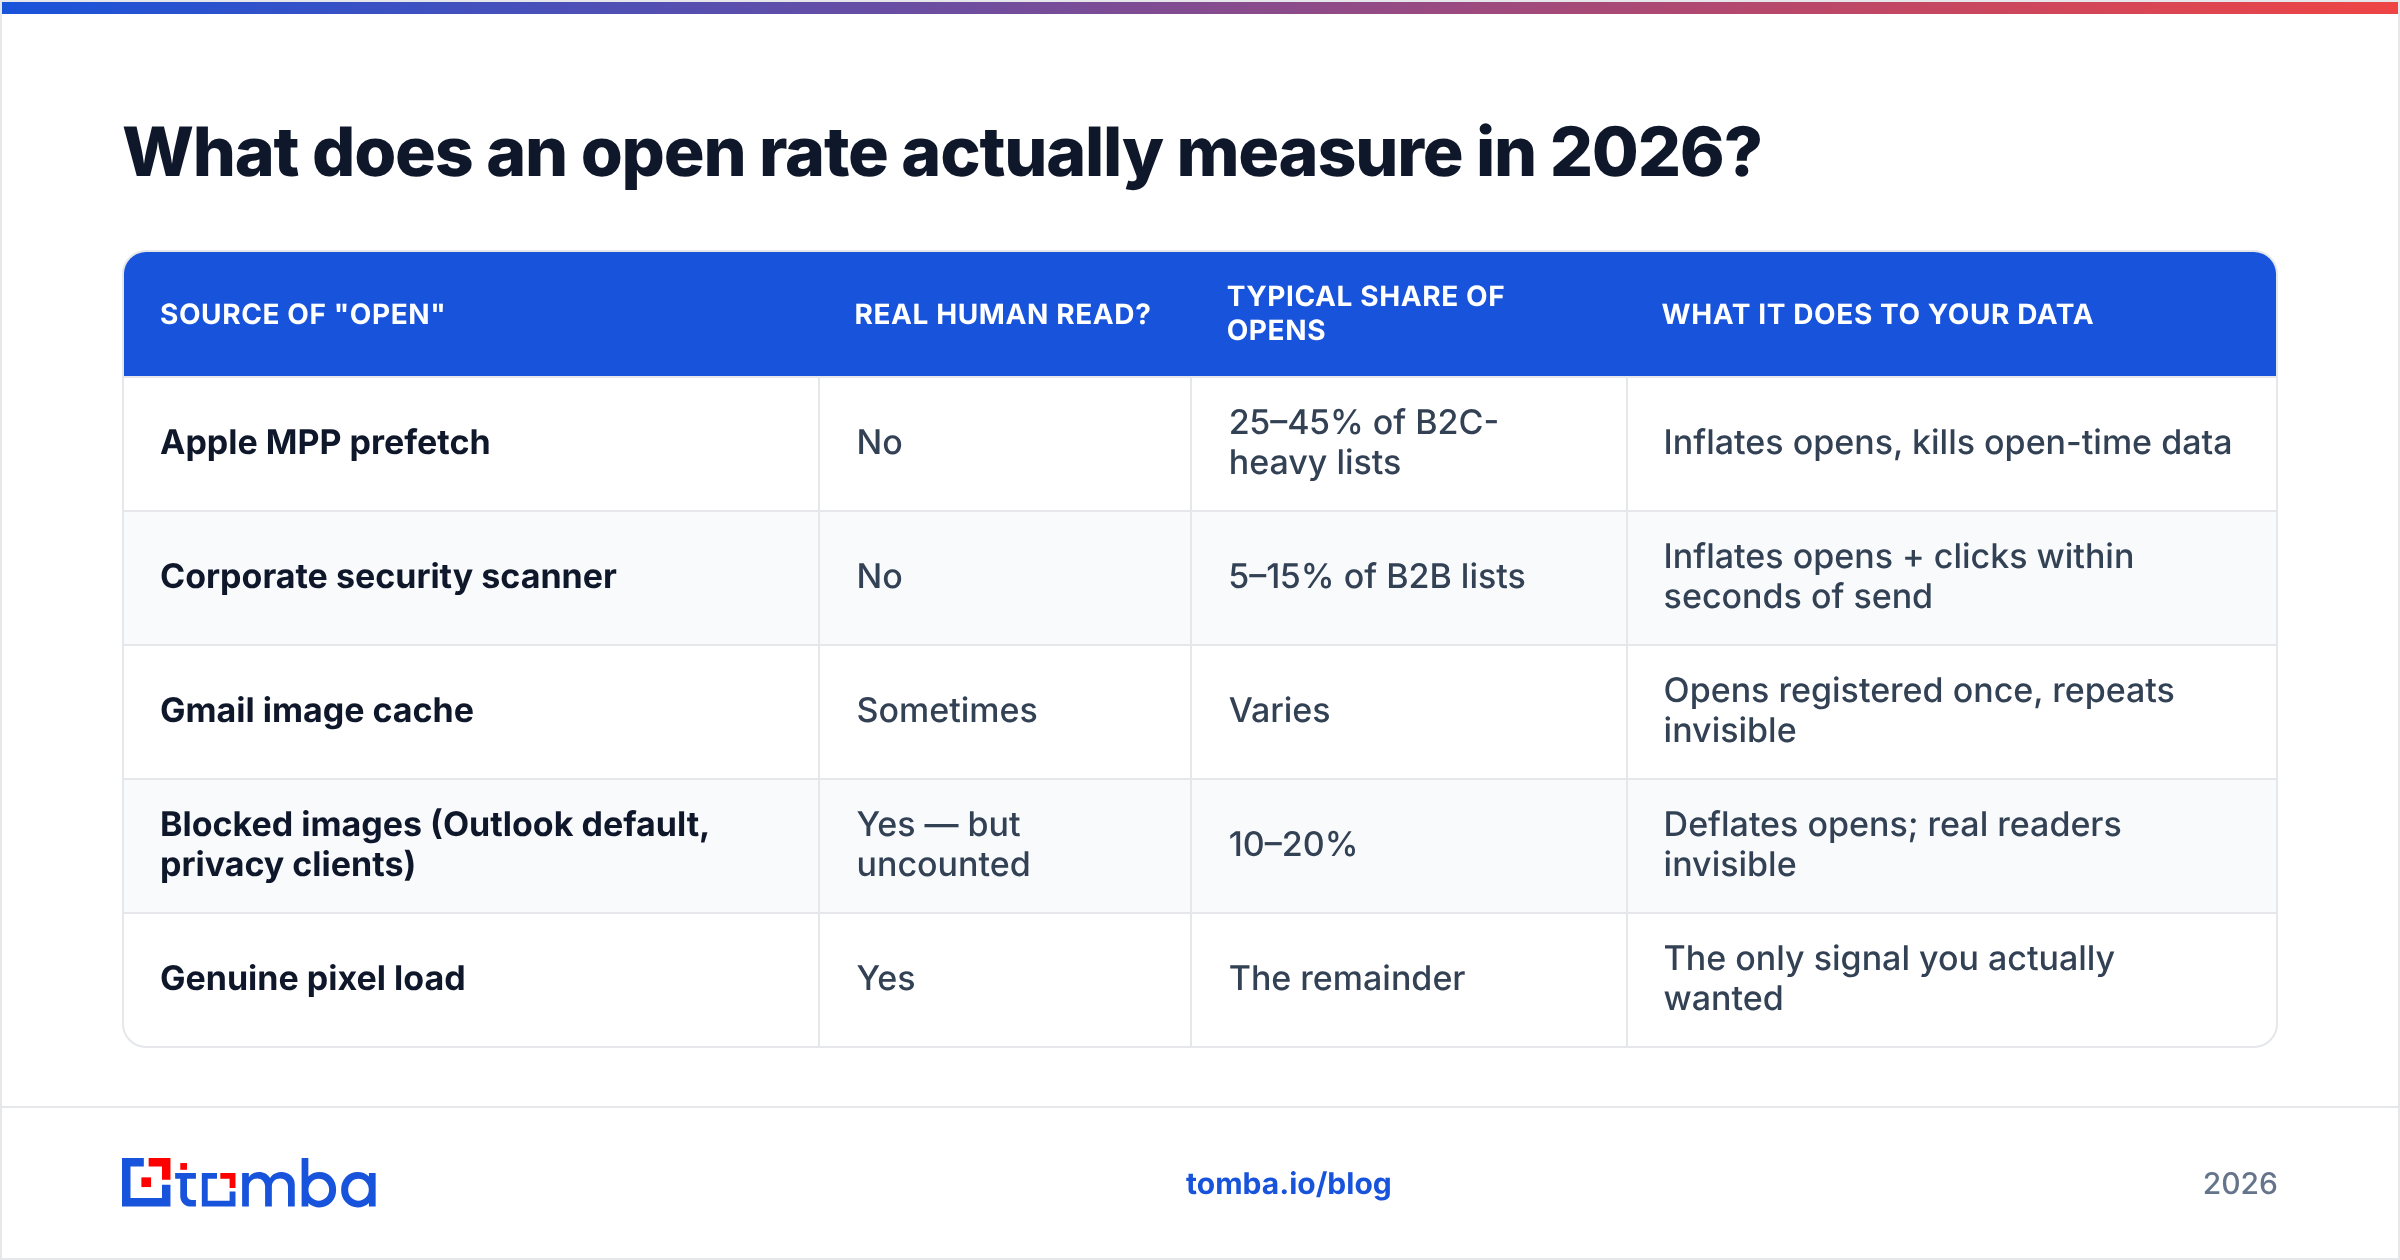
Here is the honest breakdown of what sits inside a modern open-rate number:
| Source of "open" | Real human read? | Typical share of opens | What it does to your data |
|---|---|---|---|
| Apple MPP prefetch | No | 25–45% of B2C-heavy lists | Inflates opens, kills open-time data |
| Corporate security scanner | No | 5–15% of B2B lists | Inflates opens + clicks within seconds of send |
| Gmail image cache | Sometimes | Varies | Opens registered once, repeats invisible |
| Blocked images (Outlook default, privacy clients) | Yes — but uncounted | 10–20% | Deflates opens; real readers invisible |
| Genuine pixel load | Yes | The remainder | The only signal you actually wanted |
Two teams can run the same quality of campaign. One reports 22%, the other 61%. The gap is list makeup, nothing else. That is not a metric. That is a coin flip with a spreadsheet attached.
So stop tuning subject lines against open rate alone. A/B tests are still worth running. Just score them on replies or clicks. Otherwise you crown the version that happened to reach more Apple users.
Which metrics should replace open rate?#
Once you treat email open rates declining as noise, these five carry the signal. They are listed in rough order of quality for B2B outbound.
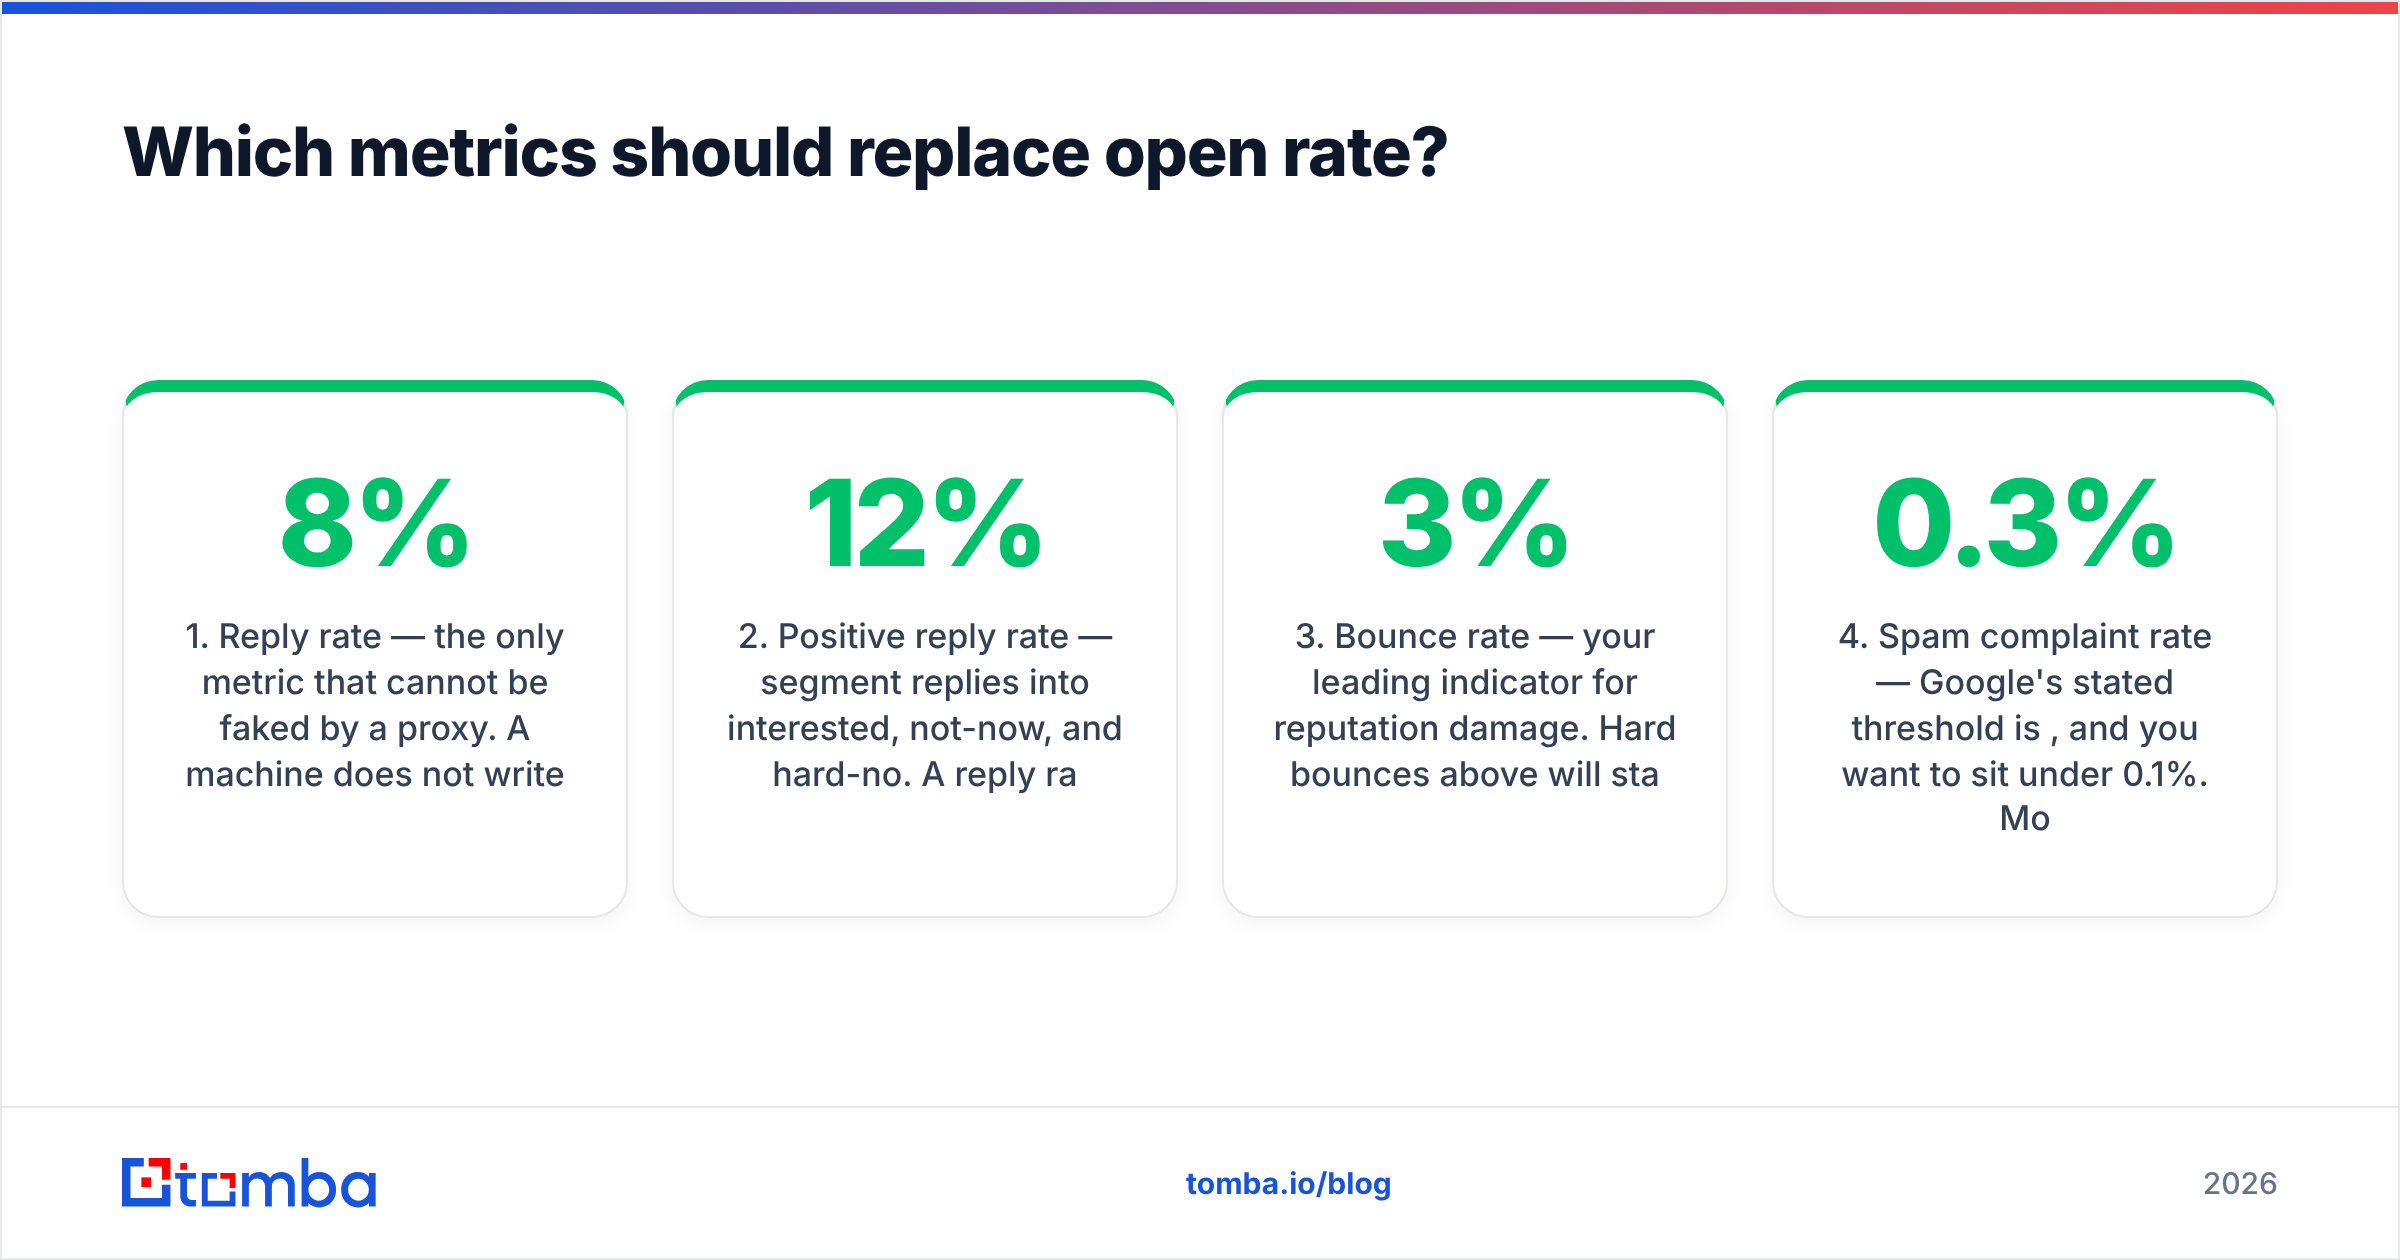
Reply rate — the one number a proxy cannot fake. A machine does not write back. For cold outreach, 3–8% is a working range. Above 10% means your targeting is good, or your list is small and hand-built.
Positive reply rate — sort replies into interested, not now, and hard no. A 12% reply rate that is 90% "unsubscribe me" is worse than a 4% rate where half are curious. This is the number that predicts pipeline.
Bounce rate — your early warning for reputation damage. Hard bounces above 3% start costing you inbox placement. Above 5% you are burning the domain. This is a data problem, and you can fix it before you hit send.
Spam complaint rate — Google's stated limit is 0.3%. Aim to stay under 0.1%. Watch it in Google Postmaster Tools. Nothing kills a sending domain faster.
Meetings booked per 100 verified contacts — the denominator matters. Not per 100 sent. Per 100 verified. It compares fairly across list sizes, and it puts data quality and copy quality in the same number.
Want one north-star number? Use meetings per 100 verified contacts. It folds in deliverability, targeting, and copy. No privacy proxy can bend it.
How do you tell a data problem from a copy problem?#
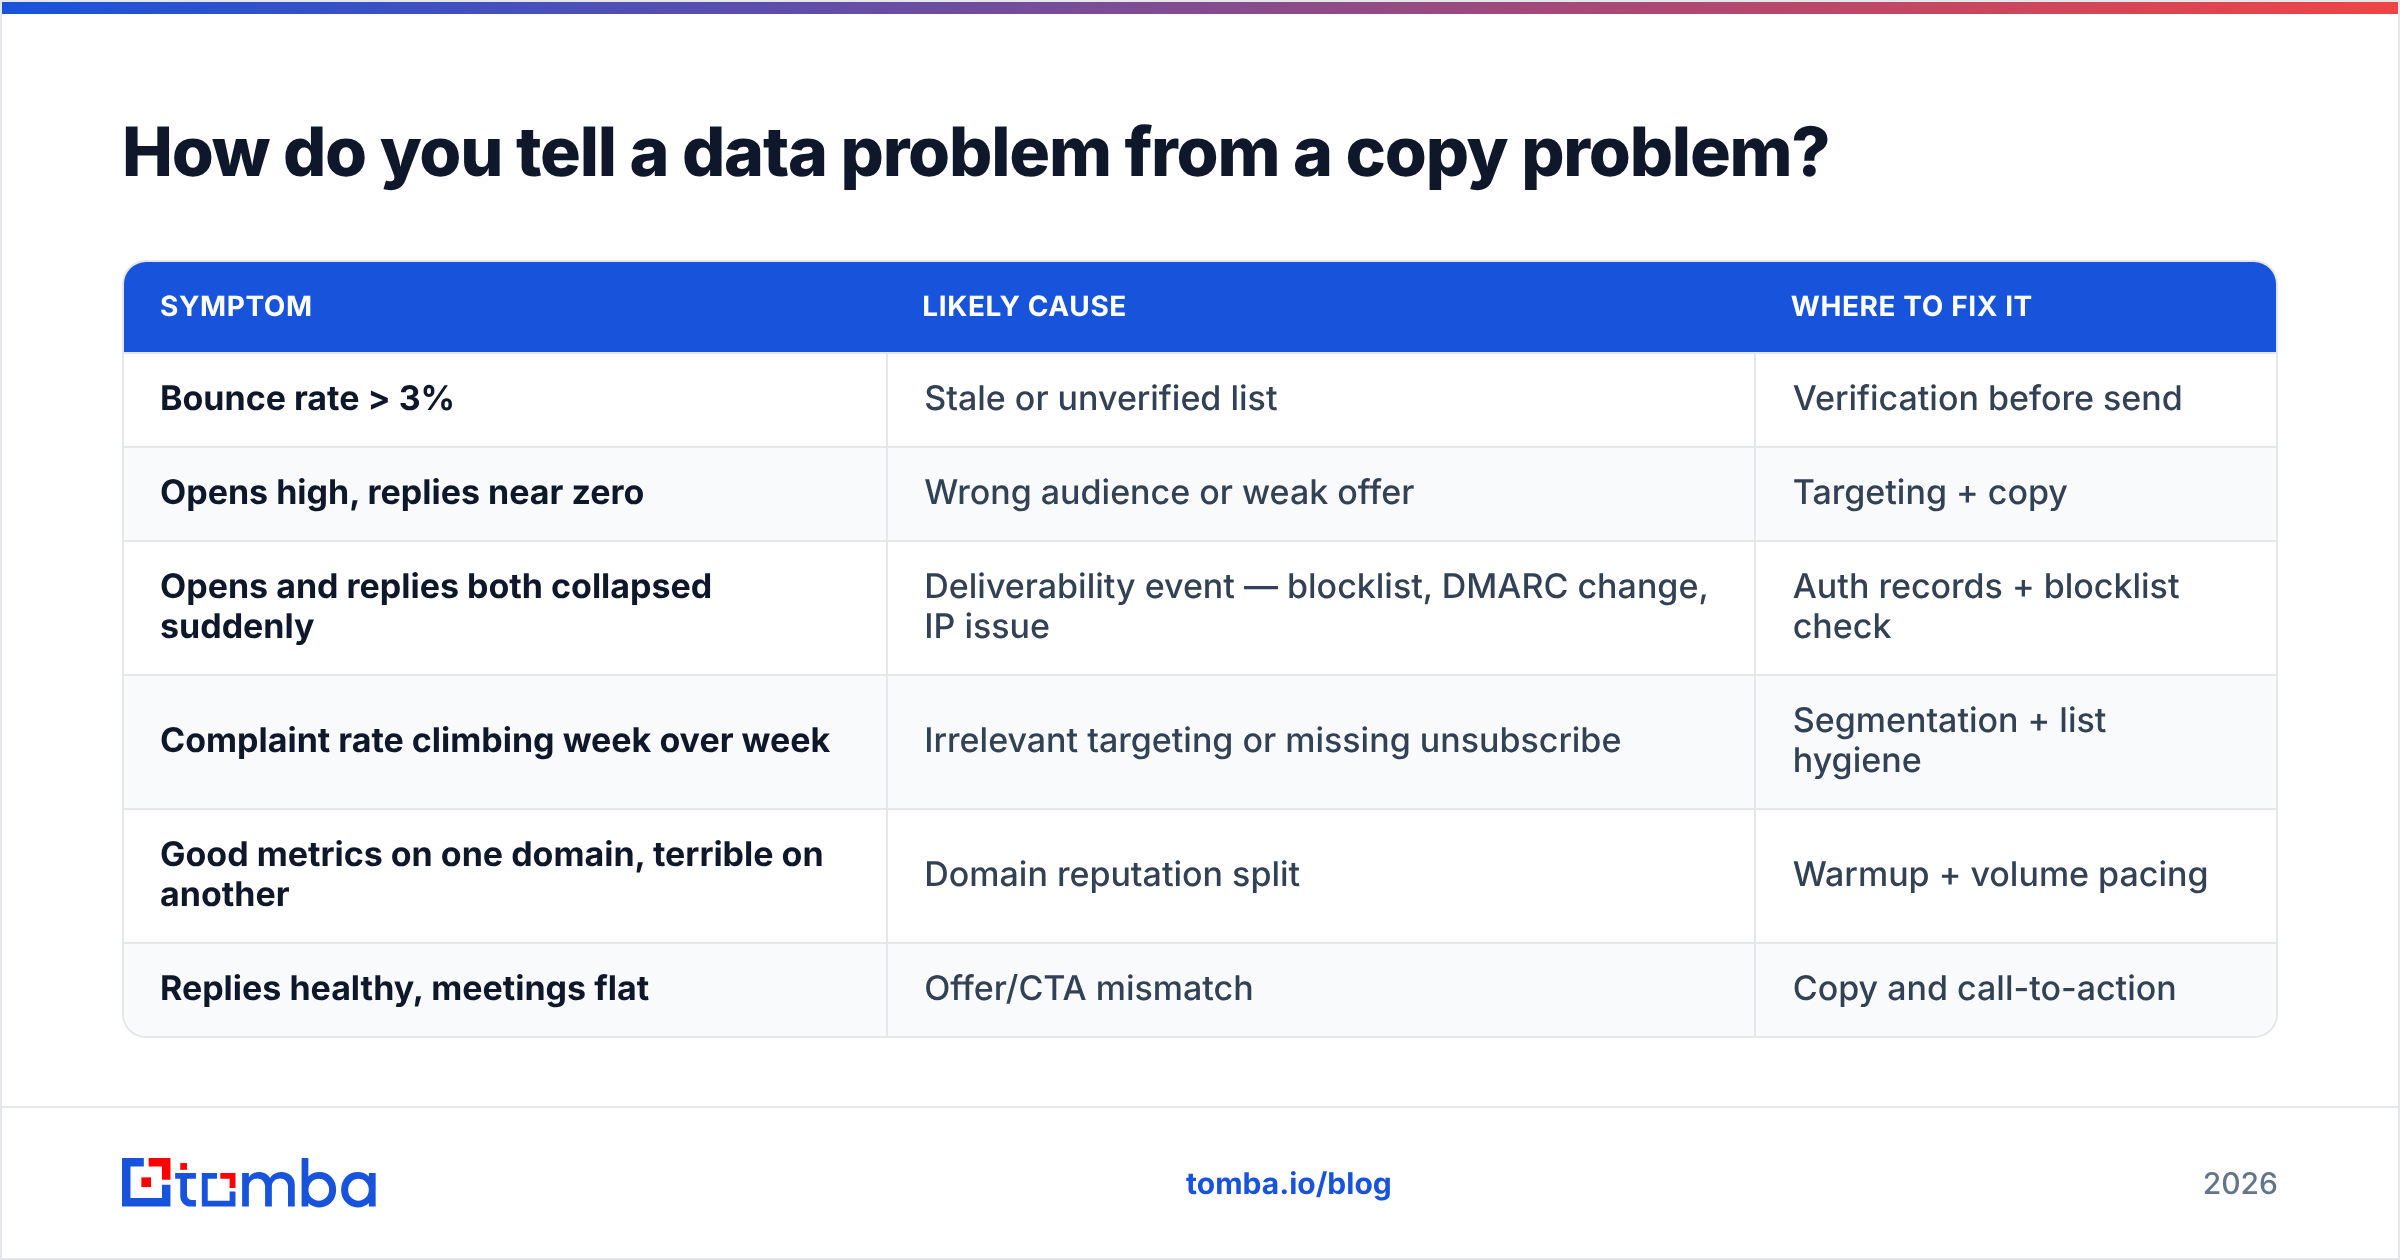
Look at where the funnel breaks, not at the top-line number. Teams with email open rates declining usually find the break lower down.
| Symptom | Likely cause | Where to fix it |
|---|---|---|
| Bounce rate > 3% | Stale or unverified list | Verification before send |
| Opens high, replies near zero | Wrong audience or weak offer | Targeting + copy |
| Opens and replies both collapsed suddenly | Deliverability event — blocklist, DMARC change, IP issue | Auth records + blocklist check |
| Complaint rate climbing week over week | Irrelevant targeting or missing unsubscribe | Segmentation + list hygiene |
| Good metrics on one domain, terrible on another | Domain reputation split | Warmup + volume pacing |
| Replies healthy, meetings flat | Offer/CTA mismatch | Copy and call-to-action |
Here is the part most teams miss. Bounce rate and open rate are linked. Every hard bounce is a small deposit in a reputation account. That account decides whether your next 500 emails see the inbox or the spam folder. A list with 12% bad addresses does not just waste 12% of sends. It drags down placement for the other 88%.
That is why list hygiene comes first. Run contacts through an email verifier before a campaign. It is the cheapest deliverability fix there is, not a polish step. Catch-all domains need their own catch-all verifier. They accept every address at the SMTP layer and reject it later, so a standard check returns "accept-all" and tells you nothing.

Is open rate still worth tracking at all?#
Yes. As a smoke alarm, not a scoreboard.
Keep it for three narrow jobs:
Anomaly detection. If open rate falls from 34% to 9% overnight, something broke. A DNS change, a blocklist entry, a bad template. The absolute number means little. The delta is a real alert.
Comparison inside one segment. Two subject lines, same list, same day still tells you something. The measurement bias is the same on both sides.
Domain-level health. Track open rate per sending domain over months. It flags reputation decay before bounces do.
Stop doing three things. Reporting open rate to leadership as performance. Setting quarterly targets on it. Believing a vendor who says "our customers see 60% open rates." That number tells you about their customers' Apple Mail share, not their product.
What does the fix look like day to day?#
Four changes, in order of impact. Each one does more about email open rates declining than any subject-line test.
1. Fix authentication first. SPF, DKIM, and DMARC are table stakes. If DMARC is missing, or set to p=none with nobody reading the reports, you are blind. You cannot see who sends as you, and providers get no trust signal. Check your records with an SPF checker. Confirm you are clean with a blacklist checker. It is a one-afternoon fix, and everything else depends on it.
2. Verify before every send, not once a quarter. B2B contact data decays 22–30% a year. People change jobs. Companies merge. Domains move. A list you verified in January is worse by June. Put verification in the send workflow, not the quarterly cleanup.
3. Pace volume against domain age. A new domain that sends 500 cold emails on day three gets filtered, full stop. Warm up over 4–6 weeks. Ramp slowly. Keep daily volume per domain low. A warmup calculator gives you a real schedule instead of a guess.
4. Send less, aim better. This is the least popular fix and the best one. Providers score on engagement now: replies, moves out of spam, adds to contacts. Send 200 sharp emails, get 15 replies, and you build reputation. Send 5,000 generic ones for the same 15 replies and you burn it. Same result, opposite direction.
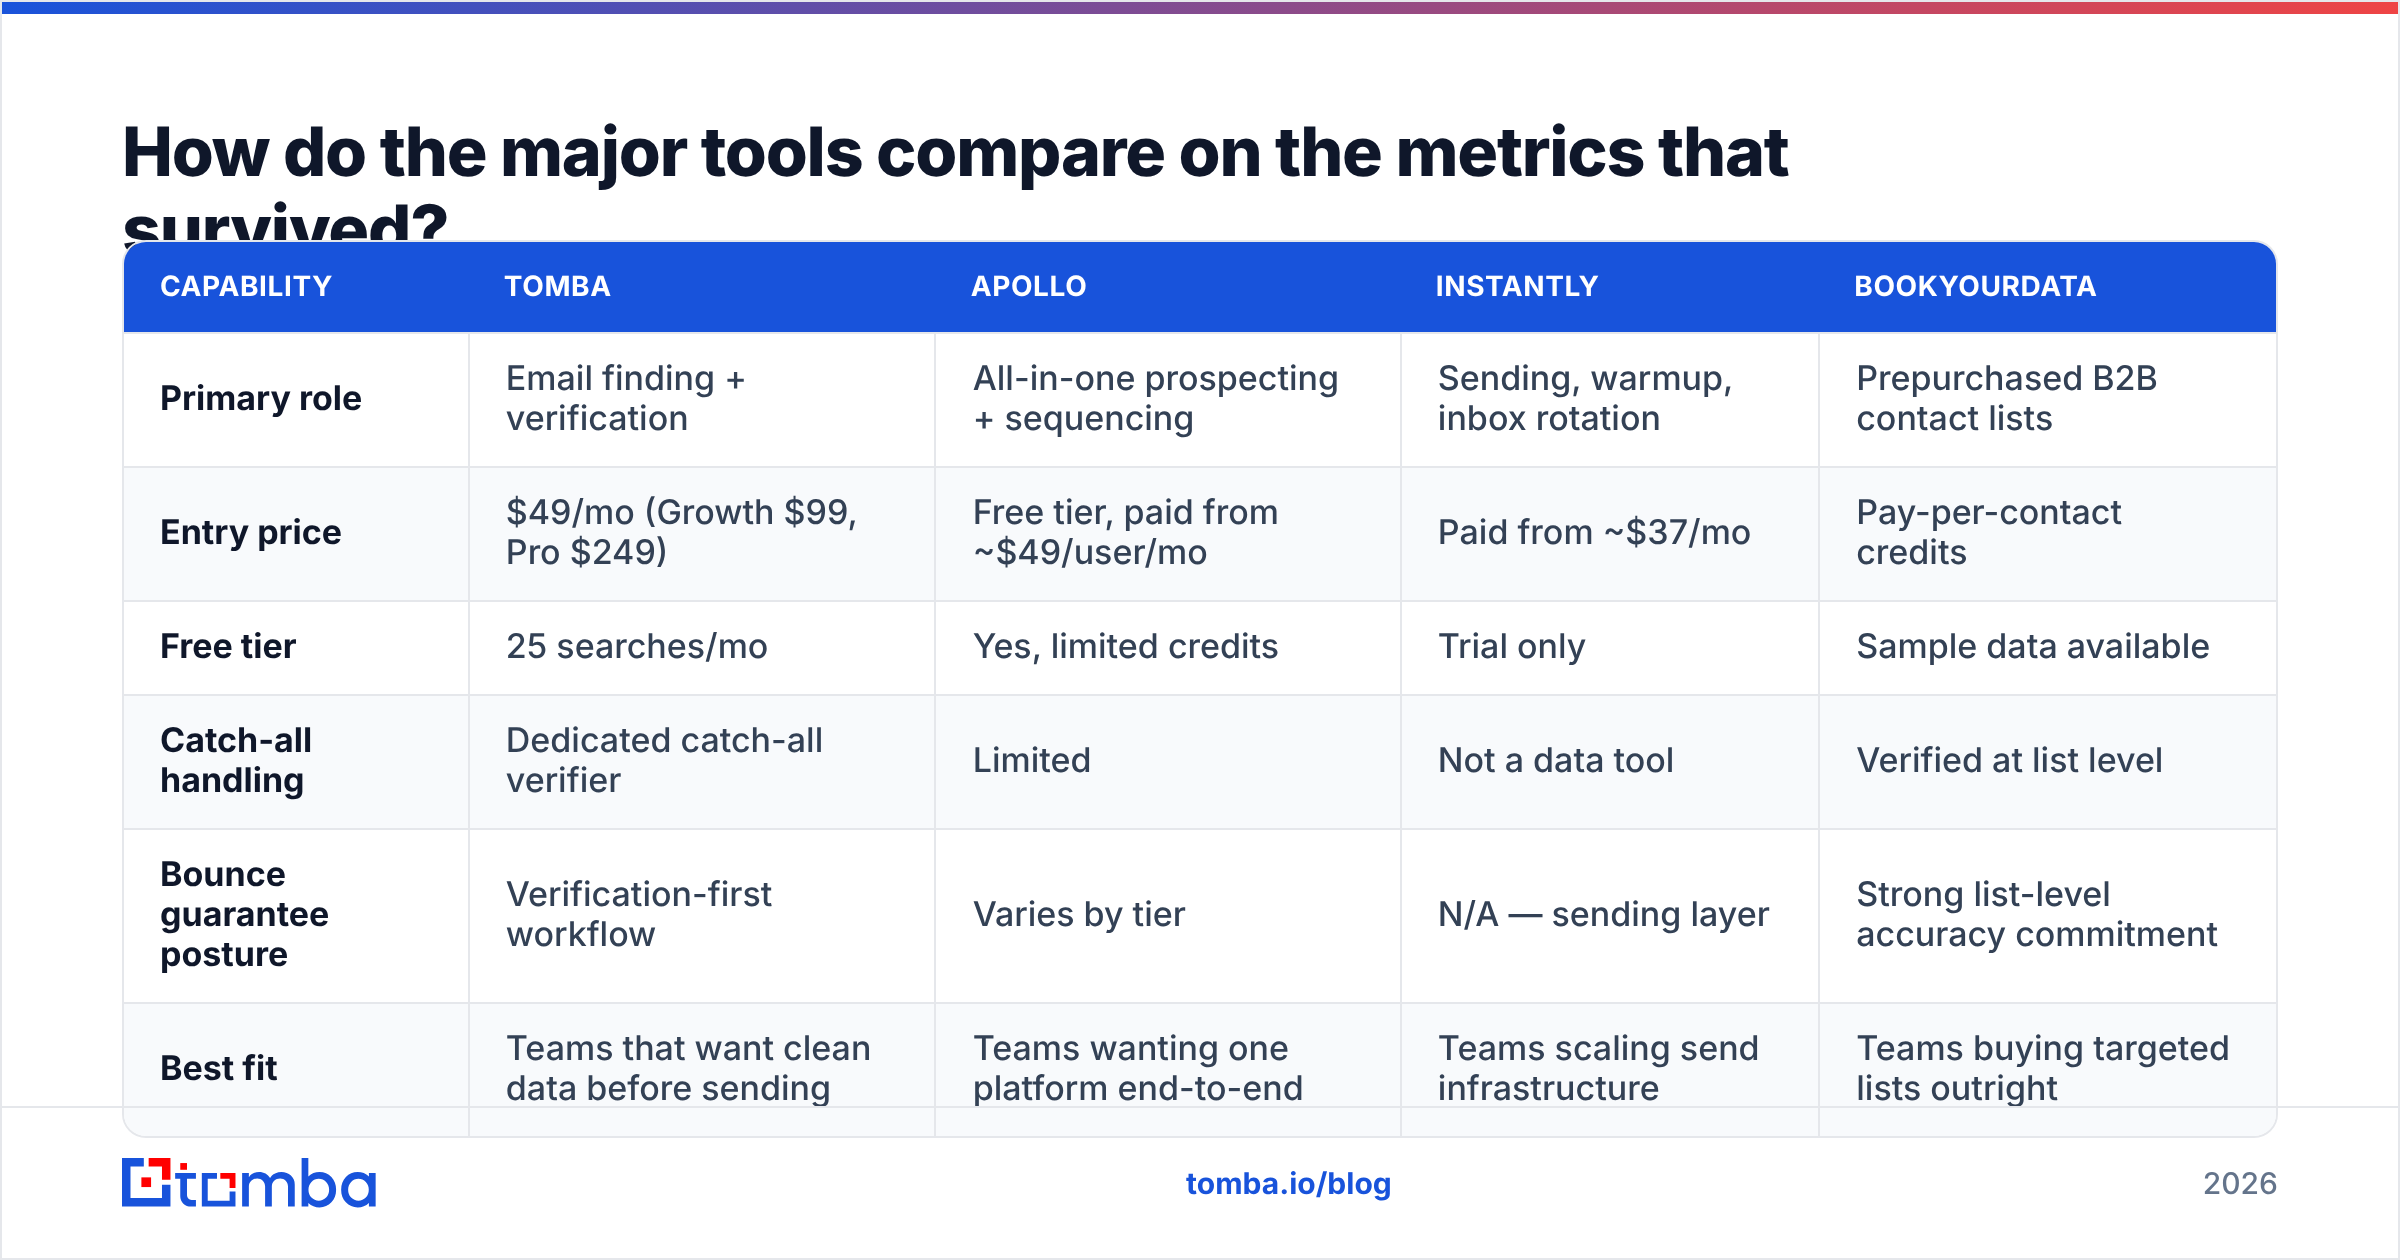
How do the major tools compare on the metrics that survived?#
Most outreach and data platforms still lead with open rate, because that is the number buyers ask about. Here is how the categories really differ on what matters:
| Capability | Tomba | Apollo | Instantly | BookYourData |
|---|---|---|---|---|
| Primary role | Email finding + verification | All-in-one prospecting + sequencing | Sending, warmup, inbox rotation | Prepurchased B2B contact lists |
| Entry price | $49/mo (Growth $99, Pro $249) | Free tier, paid from ~$49/user/mo | Paid from ~$37/mo | Pay-per-contact credits |
| Free tier | 25 searches/mo | Yes, limited credits | Trial only | Sample data available |
| Catch-all handling | Dedicated catch-all verifier | Limited | Not a data tool | Verified at list level |
| Bounce guarantee posture | Verification-first workflow | Varies by tier | N/A — sending layer | Strong list-level accuracy commitment |
| Best fit | Teams that want clean data before sending | Teams wanting one platform end-to-end | Teams scaling send infrastructure | Teams buying targeted lists outright |
These tools are complements more than rivals. A realistic 2026 stack has three layers. A data layer that finds and verifies contacts. A sending layer that runs warmup and rotation. A CRM that records replies. BookYourData and Tomba both serve the data layer from different angles: bought lists versus on-demand search and verification. Plenty of teams use both, depending on the week.
For a wider view of how buyers rate these categories, G2's email marketing and sales intelligence grids are a fair neutral read. HubSpot's deliverability documentation covers the authentication mechanics without vendor spin.
What should you do this week?#
A short, ordered checklist for anyone watching email open rates declining:
Audit the last 90 days by domain, not by campaign. Split metrics per sending domain. One domain usually drags the average.
Pull your bounce list and count the waste. Measure hard bounces as a share of sends. Over 2% means you fix the data before the copy.
Re-verify your active list. Run every contact you plan to email in the next 30 days. Use bulk verification so it is one job, not one thousand.
Add reply rate and positive reply rate to your reports. Move open rate to a "health signals" section. Rename it "pixel loads" if you want to make the point internally.
Set up Google Postmaster Tools. It is free. It shows real spam-rate and domain-reputation data. It is the closest thing to ground truth you will get.
Check DMARC and move toward enforcement. Start at
p=nonewith reporting on. Read two weeks of aggregate reports. Then move toquarantine.
None of this lifts your open rate. That is the point. You are replacing a broken gauge, not repairing it.
The uncomfortable summary#
Email open rates declining is two stories in one. The metric was always a proxy, and the proxy got poisoned. Meanwhile the channel itself got pickier. Both are true. Teams that spent 2024 and 2025 chasing open-rate gains mostly optimized for Apple Mail share.
The teams doing well made a boring switch. They stopped measuring whether an image loaded. They started measuring whether a human replied. Then they worked backward from replies. The biggest lever turned out not to be subject lines at all. It was whether the address was real, whether the person still worked there, and whether the message earned thirty seconds.
That is a data problem wearing a marketing problem's clothes.
Start where the leverage is. If you see email open rates declining and your bounce rate sits above 2%, no subject-line test will save you. The list is the problem. Tomba Email Finder finds verified professional addresses by domain, name, or company. It includes catch-all detection and confidence scoring, so contacts are real before they cost you reputation. The free tier gives you 25 searches a month to test against your own list. Paid plans start at $49/mo, and the full Tomba pricing page helps you match volume to send cadence. Clean data first. Copy second.
Related guides#
Ready to find emails that actually work?
Join 150,000+ professionals who stopped guessing and started sending. Free credits on signup — no credit card required.
Get the Tomba newsletter
Practical outbound tactics and product updates — once every two weeks.
About the author